Our system will evaluate the answer based on this AI-generated description.
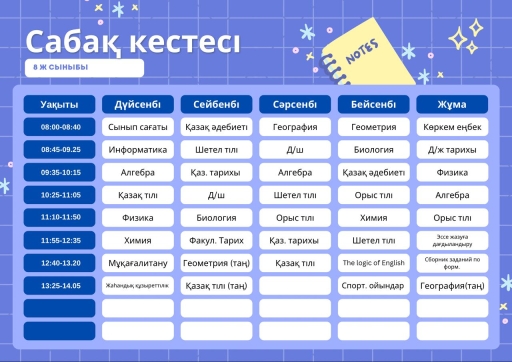
The image displays a school timetable titled "Сабақ кестесі" for "8 Ж СЫНЫБЫ". The schedule covers five days, with time slots from 08:00 to 14:05. Дүйсенбі (Monday) schedule: 08:00-08:40 Сынып сағаты, 08:45-09:25 Информатика, 09:35-10:15 Алгебра, 10:25-11:05 Қазақ тілі, 11:10-11:50 Физика, 11:55-12:35 Химия, 12:40-13:20 Мұқағалитану, 13:25-14:05 Жаһандық құзыреттілік. Сейсенбі (Tuesday) schedule: 08:00-08:40 Қазақ әдебиеті, 08:45-09:25 Шетел тілі, 09:35-10:15 Қаз. тарихы, 10:25-11:05 Д/ш, 11:10-11:50 Биология, 11:55-12:35 Факул. Тарих, 12:40-13:20 Геометрия (таң), 13:25-14:05 Қазақ тілі (таң). Сәрсенбі (Wednesday) schedule: 08:00-08:40 География, 08:45-09:25 Д/ш, 09:35-10:15 Алгебра, 10:25-11:05 Шетел тілі, 11:10-11:50 Орыс тілі, 11:55-12:35 Қаз. тарихы, 12:40-13:20 Қазақ тілі. Бейсенбі (Thursday) schedule: 08:00-08:40 Геометрия, 08:45-09:25 Биология, 09:35-10:15 Қазақ әдебиеті, 10:25-11:05 Орыс тілі, 11:10-11:50 Химия, 11:55-12:35 Шетел тілі, 12:40-13:20 The logic of English, 13:25-14:05 Спорт. ойындар. Жұма (Friday) schedule: 08:00-08:40 Көркем еңбек, 08:45-09:25 Д/ж тарихы, 09:35-10:15 Физика, 10:25-11:05 Алгебра, 11:10-11:50 Орыс тілі, 11:55-12:35 Эссе жазуға дайындандыру, 12:40-13:20 Сборник заданий по форм., 13:25-14:05 География(таң).
Given the complexity of the image, the above description may not be entirely accurate.
Skyrocket your IELTS band score by 1-2 points in under a month with our premium plan!
Note: Both the topic and the answer were created by one of our users.
The three pie charts compares the difference in yearly expenditures in one of the pubic school in Canada in 1990, 2000, and 2010 under different headings.
Overall, teachers salaries consumed the largest share of budget in all these years, while the percentage of spending on facilities and maintenance as well as technology grew steadily over the years. Then there is resources for learning which took the same percentage of budget over the years.
In three decades, salaries of teacher’s had the largest share of spending with 55%, 50%, and 45% in 1990, 2000, and 2010 respectively. However, in all those years, learning resources had a constant share of percentage (10%). Technology, on the other hand, had a gradual rise in expenditure percentage in the later years. That is, in 1990, 5% of total fund was separated for technology, which subsequently rose to 12% in 2010.
Similarly, percentage of funds for facilities and maintenance also increased one and half fold in two decades. 15% of total capital was allocated in 1990, which rose to 20% in 2000, and 25% in 2010. Conversely, sending on ‘other’ heading decreased as we entered 2000s. In 1990, 15% of fund was separated, which gradually dropped to 8% of total fund in 2010.
Word Count: 207
