Our system will evaluate the answer based on this AI-generated description.
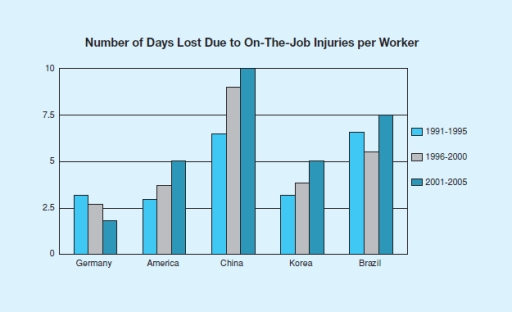
The image is a bar graph representing the number of days lost due to on-the-job injuries per worker across five countries over three-time periods. In Germany, 1991-1995 shows 2.5 days, 1996-2000 shows 5 days, and 2001-2005 shows 3.75 days. In America, 1991-1995 shows 5 days, 1996-2000 shows 7.5 days, and 2001-2005 shows 5.75 days. In China, 1991-1995 shows 7.5 days, 1996-2000 shows 10 days, and 2001-2005 shows 6.25 days. In Korea, 1991-1995 shows 10 days, 1996-2000 shows 2.5 days, and 2001-2005 shows 5 days. In Brazil, 1991-1995 shows 5 days, 1996-2000 shows 3.75 days, and 2001-2005 shows 2.5 days. The x-axis lists the countries Germany, America, China, Korea, and Brazil, and the y-axis measures the number of days from 0 to 10 in increments of 2.5. There are three sets of bars for each country, each representing a different time period with the key indicating light blue for 1991-1995, dark blue for 1996-2000, and medium blue for 2001-2005.
Given the complexity of the image, the above description may not be entirely accurate.
Skyrocket your IELTS band score by 1-2 points in under a month with our premium plan!
Note: Both the topic and the answer were created by one of our users.
The bar graph illustrates the three times periods shown beginning with the year 1991 and ending in 2005. China show the most amount of days since year 2001 till 2005. Germany show the lowest level among all of the countries. We can see the drop, unstabillity, grow.
also, it is noticeable that before workers were more responsible, but now started lost days of job, because of injurity.Country with the highest figure of lost working days, compared with other two. The difference benween highest and lowest was quite significant at the beginning of the period.
By 2005, all three countries had reduced their figures. The leading country still recorder the highest scores, but the gap between it and the others became smaller. The country that initially had the lowest level continued to remain at the bottom, such as Germany or Brazil. Overall, the data suggest that workplace safety improved over the yeras in all three countries
Word Count: 155