Our system will evaluate the answer based on this AI-generated description.
The image shows a scatter plot graph of "GDP per capita vs. Average temperature." The x-axis represents the average temperature in °C, ranging from -5°C to 45°C, and the y-axis represents GDP per capita in $, ranging from 10 to 100K. Key data points include various countries: Grenada (20°C, 10K); Iceland (2°C, 45K); Canada (5°C, ~45K); Malta (18°C, 35K); Botswana (22.5°C, 8-9K); Germany (10°C, 47.5K); Uruguay, Denmark, Ecuador, and Rwanda at varying average temperatures and GDPs per capita; United States (13°C, 57K); Luxembourg (9°C, 108K); Norway (4-5°C, 55K); Switzerland (8°C, 80K); Belgium (11°C, 47K); Liechtenstein (8-9°C, 105K); India (25°C, 1.5K); China (16°C, 8K); Chad (28°C, <1K); Libya (22.5°C, 7-8K); Singapore (27-28°C, 85K); Brazil (23.5°C, 8-9K); Japan (12°C, 38K); Russia (0°C, 10K); Kenya (21.5°C, <2K); Norway (6-7°C, 80K); South Korea (12°C, 27-28K); United Kingdom (10.5°C, 42K); Twazi (0°C, <1K); Australia (22°C, 55-65K). A trend line shows a negative correlation between GDP per capita and average temperature, denoted by R² = 0.56.
Given the complexity of the image, the above description may not be entirely accurate.
Skyrocket your IELTS band score by 1-2 points in under a month with our premium plan!
Note: Both the topic and the answer were created by one of our users.
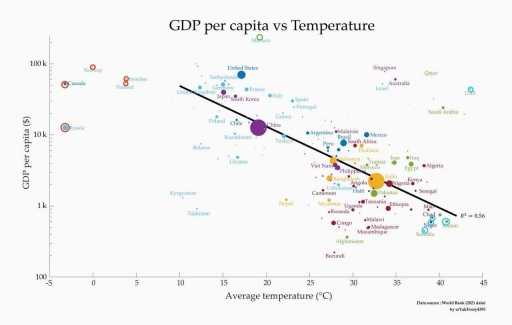
GDP per capita vs Temperature
The diagram shows the relationship between GDP per capita and temperature, based on data from the World Bank in 2021. Monaco stands out as the country with the highest GDP per capita, despite having an average temperature that is relatively moderate.
Overall, we can clearly see that cooler countries like Norway, Sweden, Canada, and Finland have a higher GDP per capita. On the other hand, warmer countries with higher temperatures such as Niger, Somalia, Yemen, and Chad have lower GDP per capita.
Firstly, countries such as Norway, Sweden, Canada, and Finland, which have cooler temperatures around 0°C, have a higher GDP per capita, often nearing $60,000. We can see that most countries with average temperatures below 20°C have higher GDP per capita. Notably, Norway has the highest GDP per capita, exceeding $70,000. However, Russia, despite having the coldest temperature around -4°C, has a lower GDP per capita, about $20,000.
Secondly, Niger, Somalia, Yemen, and Chad, which have warmer temperatures around 40°C, have the lowest GDP per capita, usually around $700. It is evident that countries with average temperatures above 20°C tend to have lower GDP per capita. Notably, Somalia has the lowest GDP per capita, about $600. Nonetheless, the UAE, which has one of the highest average temperatures around 43°C, has a high GDP per capita, around $70,000.
Word Count: 223