Our system will evaluate the answer based on this AI-generated description.
The image shows a line graph from 1988 to 2014 with four categories: "Company Shares," "Fine Art," "Gold," and "Property." In 1988 all values start slightly above 0. By 1992, gold and company shares reached slightly above 50, fine art stayed below 50, and property remained steady. By 1996, gold slightly dipped under other sectors; in 2000, gold and company shares both near 100, property slightly increased. By 2004, gold led around 130, company shares approximately 130, fine art reached near 100, property under 100. In 2008, gold soared to 200, company shares around 150, property rises above 100, fine art slightly below gold. By 2010, gold spikes sharply to 400, company shares at 200, property around 150, fine art just over 100. In 2012, gold peaks over 450, company shares near 300, property approaches 200, fine art above 150. By 2014, gold decreases slightly under 400, company shares over 300, property aligns close to 200, fine art steady around 200.
Given the complexity of the image, the above description may not be entirely accurate.
Skyrocket your IELTS band score by 1-2 points in under a month with our premium plan!
Note: Both the topic and the answer were created by one of our users.
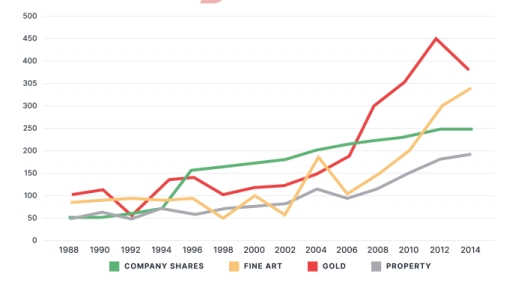
The graph illustates the amount of money invested in funds of four examined categories named property, gold, fine art, company shares between 1988 and 2014.
In general, the figures for all categories increased over time. Additionally, gold had the highest value of investment funds.
In 1988, the amount of money spent for property and company shares were around 50 million, while that of fine art and gold were double higher, at nearly 100 million. In the following 18 years, the figure for fine art saw a fluatuation from nearly 50 million to 150 million, while the amount of money invested in property was slightly rose, about 100 million. moreover, gold and company shares also atractted a significant investment, which were more than 200 million dollars.
From 2006 to 2014, Gold underwent a dramatic increase and became the greatest investment, reaching peak at approximately 450 million, before slightly decreasing to around 370 million. the figure for money spent in fine art investment also countinually rose from 100 to 340 million. Comparatively, since 2006 the value of the company shares and property has only increased to 50 and 200 million respectively.
Word Count: 189