🔥 Today Only: Save 30% on Premium — Offer Ends Soon! - Upgrade Now!
Line Graph

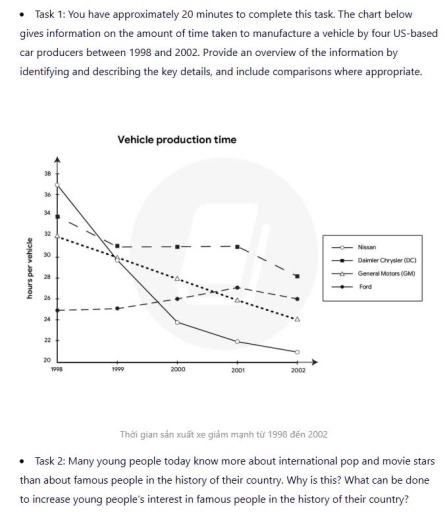
Band 5+: You have approximately 20 minutes to complete this task. The chart below shows information about the amount of time needed to produce a vehicle by four car manufacturers based in the US between 1998 and 2002. Provide a summary of the main features by identifying and describing the key details, and include comparisons where relevant.

Image for topic: You have approximately 20 minutes to complete this task. The chart below shows information about the amount of time needed to produce a vehicle by four car manufacturers based in the US between 1998 and 2002. Provide a summary of the main features by identifying and describing the key details, and include comparisons where relevant.
Our system will evaluate the answer based on this AI-generated description.
The image presents a line graph depicting vehicle production time from 1998 to 2002 for four US-based manufacturers: Nissan, Daimler Chrysler (DC), General Motors (GM), and Ford. In 1998, Nissan's production time was about 20 hours, DC's was approximately 32 hours, GM's was around 28 hours, and Ford's was roughly 33 hours. By 1999, Nissan reduced to approximately 18 hours, DC to about 31 hours, GM to approximately 27 hours, and Ford to nearly 29 hours. In 2000, Nissan's production stood at around 18 hours, DC's at 28 hours, GM's at about 26 hours, and Ford's was under 27 hours. In 2001, Nissan further decreased to around 16 hours, DC to 26 hours, GM to about 25 hours, and Ford to 24 hours. By 2002, all reduced further, with Nissan at approximately 15 hours, DC at about 22 hours, GM at about 23 hours, and Ford reaching around 21 hours.
Given the complexity of the image, the above description may not be entirely accurate.
Note: Both the topic and the answer were created by one of our users.

The line graph illustrates the amount of time taken to produce a vehicle by four US based car manufacturers in the years between 1998 and 2002.

Overall, nissan showed reduction of production time. While Ford’s production time remained relatively stable compared with the others.

It can be clearly seen that nissan had the longest production about 37 hours to produce the vehicle. However, it dropped gradually over the follow years and reached 21 hours in 2002, becoming the lowest among the other.Similarly, general motors also experienced downward trend by decreasing gradually from 32 hours to 24 hours by the end of the period.

In the 1998 Dalmler Chrysler needed 34 hours for production time. This figure declined to 32 hours in 1999 and remained stable next three years in a row. In the 2002 steadily declined to about 28 hours. In comparison, Ford production time showed minor changes, remaining 26 hour in the end of the period.

Баға бер

Word Count: 159

Answers On The Same Topic:

You have approximately 20 minutes to complete this task. The chart below shows information about the amount of time needed to produce a vehicle by four car manufacturers based in the US between 1998 and 2002. Provide a summary of the main features by identifying and describing the key details, and include comparisons where relevant.

The graph below demonstrates the quantity of time taken to create a vehicle by four US-based automobile companies between 1998 and 2002. In general, all types of vehicles have reduced the time reduired to produce a vehicle. It’s worth noticing that Nissan declined rapidly wrereas Ford increased slightly the first four years and decreased gradually […]

You have approximately 20 minutes to complete this task. The chart below shows information about the amount of time needed to produce a vehicle by four car manufacturers based in the US between 1998 and 2002. Provide a summary of the main features by identifying and describing the key details, and include comparisons where relevant.

The presented line graph depicts comparative data of time taken to fabricate an automobile by four US-based car companies, namely Nissan, Daimler Chrysler, General Motors and Ford from 1998 through 2002. At the first glance, it is clear, that all of the car producers decreased in 2002. At the begging, Ford had taken the least […]

You have approximately 20 minutes to complete this task. The chart below shows information about the amount of time needed to produce a vehicle by four car manufacturers based in the US between 1998 and 2002. Provide a summary of the main features by identifying and describing the key details, and include comparisons where relevant.

The line graph illustrates percentage of required to manufacture a single vehicle by four different US-based car producers (Nissan, Daimler Chrysler, General Motors, and Ford) over a five-year period from 1998 to 2002. Overall it is clear that three out of four companies reduce their production time,Nissan showed the significant improvement. In contrast Ford was […]

You have approximately 20 minutes to complete this task. The chart below shows information about the amount of time needed to produce a vehicle by four car manufacturers based in the US between 1998 and 2002. Provide a summary of the main features by identifying and describing the key details, and include comparisons where relevant.

This bar graph illustrates data period of time by hours taken to manufacture o vehicle by four US-based companies from 1998 to 2002. Overall,in this graph shows that there were increase only in Ford vehicle production.In spite of this,there were decrease in Nissan and General Motors in this period of time.In addition the time to […]

See All

Other Topics:

The graph below shows the number of international tourists visiting three different countries between 2000 and 2010.

The given line graphs provide information about the number of tourists visiting three countries (The Usa, France, and Japan) over a 10-years period from 2000 to 2010. Overall, it is evident that in the first year, The USA was well-known with the highest number of tourists, while at the end of the period, the place, […]

The graph below describes oil consumption of 4 countries from 2002 to 2015, in million barrels per day.

The line graph illustrates oil consumption in four countries – A, B, C, and D – between 2002 and 2015, measured in million barrels per day. Overall, Country A consumed considerably more oil than the other three countries throughout the entire period, while Countries B and D showed similar fluctuating patterns with a sharp decline […]

The graph below describes oil consumption of 4 countries from 2002 to 2015, in million barrels per day.

The line graph illustrates the oil usage in a certain countries between 2002 and 2015, measured in million barrels. Overall,consumption levels of oil in all countries remained relatively stable throughout period , with only minor differences.Following a clear upward or downward trend. The figure of country A reached a peak in 8.0 barrels.This fraction remained […]

The graph below shows the consumption of three jam types in an Asian country from 1991 to 2004.

The line graph illustrates the eating of three jam likely Margarine, Lowfat&reduced spreads, and Butter in an Asian country between 1991 and 2014. Overall, it is clearly seen that the both butter and margarine jam was most popular in the starting year but after it consumption declined suddenly year by year. However, low fat & […]

The trends in UK consumer spending across different categories from 2000 to 2020

The line diagram illustrates different categories in UK consumer spending from 2000 to 2020. Overall, there are a rise in Beauty products. In addition in other two categories there are a decreased in their proportion. But the number of Books and Newpaper have a large decline throughout the period. On one hand, the proportion of […]

The graph below shows the consumption of three jam types in an Asian country from 1991 to 2004.

The graph compares how much jam was consumed in an Asian country over a 23-year period. Overall, it is evident that at the beginning of the period jam with butter was recorded the highest figure while low fat and reduced spreads type of jam overtook its place at the end. In addition, margarine jam fluctuated […]

See All
We have detected unusual activity on your device.
Please verify your identity to continue.
Note: This verification step won't sign you in. If you have a premium account, please log in to access the service as usual.
Google/Gmail Verification
Or verify using Email/Code
We've sent a verification code to:
youremail@gmail.com (Not your email?)
Enter it below to complete the verification process.
Ensure your email address is correct, your inbox is not full, and you check your spam folder. If no email arrives, consider using an alternative email.
You will need a Premium plan to perform your action!
Note: If you already have a premium account, please log in to access our services as usual.

Plans & Pricing

Our mission is to make quality education accessible for everyone.
However, to keep our hardworking team running and this service alive, we genuinely need your support!
By opting for a premium plan, not only do you sustain us in achieving the mission, but you also unlock advanced features to enrich your learning experience.

Free

For learners who aren't pressed for time

What's included on Free
100+ Cambridge IELTS Tests
Instant IELTS Writing Task 1 & 2 Evaluation (2 times/month)
Instant IELTS Speaking Part 1, 2, & 3 Evaluation (2 times/month)
Instant IELTS Writing Task 1 & 2 Essay Generator (2 times/month)
500+ Dictation & Shadowing Exercises
100+ Pronunciation Exercises
Flashcards
Other Advanced Tools

Premium

For those serious about advancing their English proficiency, and for IELTS candidates aspiring to boost their band score by 1-2 points (especially in writing & speaking) in just 30 days or less

What's included on Premium
Save Your IELTS Test Progress & Analyze Mistakes By Question Type
Save Your Own Flashcard Sets & Use Them On Any Device
Unlock All Courses, IELTS Tests, Section & Part Practice
Unlimited AI Conversations
Unlimited AI Writing Enhancement Exercises
Unlimited IELTS Writing Task 1 & 2 Evaluation
Unlimited IELTS Speaking Part 1, 2, & 3 Evaluation
Checked Answers Will Not Be Published
Unlimited IELTS Writing Task 1 & 2 Essay Generator
Unlimited IELTS Speaking Part 1, 2, & 3 Sample Generator
Unlimited Usage Of Advanced Tools & AI Features
Priority Support within 24h (12-month plan only)

Due to the nature of our service and the provided free trials, payments are non-refundable.
Buy activation codes in bulk and give one to each learner. A code does not expire until it is used, and each subscription only starts counting once its code is entered, so you can buy now and hand them out later.

10+ codes: 10% off 25+ codes: 15% off 50+ codes: 20% off
The codes are emailed to your payment address as soon as the payment goes through, and are also shown on the confirmation page. A tax invoice is issued automatically at checkout — select Purchasing as a business there to put your organization's name and tax ID on it.
Nếu bạn là người Việt Nam và không có hoặc không muốn trả bằng credit/debit cards, bạn có thể thanh toán bằng phương thức chuyển khoản:


Chọn gói:
419,000₫ 277,000 ₫ cho gói 1 tháng (chỉ 9,233₫/ngày)
1,239,000₫ 597,000 ₫ cho gói 3 tháng (chỉ 6,633₫/ngày)
2,469,000₫ 1,027,000 ₫ cho gói 6 tháng (chỉ 5,706₫/ngày)
4,929,000₫ 1,417,000 ₫ cho gói 12 tháng (chỉ 3,936₫/ngày)


Sau khi chuyển khoản, vui lòng đợi trình duyệt tự động điều hướng bạn trở lại Engnovate và bạn sẽ ngay lập tức nhận được mã kích hoạt tài khoản premium.
Nếu có lỗi xảy ra, bạn có thể liên hệ với team thông qua một trong các phương thức: email đến helloengnovate@gmail.com hoặc nhắn tin qua facebook.com/engnovate.
Vì toàn bộ công cụ trên website đều có thể sử dụng thử miễn phí, Engnovate không hỗ trợ hoàn tiền.