Our system will evaluate the answer based on this AI-generated description.
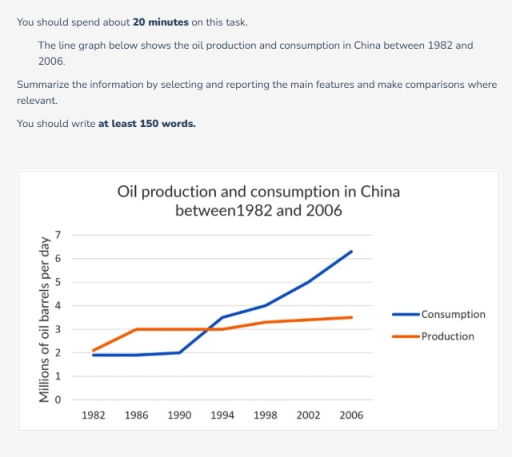
The image presents data on oil production and consumption in China from 1982 to 2006, illustrating production levels at 2 million barrels/day in 1982, consistently increasing to around 3 million barrels/day in 1986, fluctuating slightly until 1994 but stabilizing near 3 million barrels/day thereafter; consumption starts slightly below production in 1982, with less than 2 million barrels/day, then equating production in early periods, from 1986 to 1990, remaining relatively constant at around 3 million barrels/day until 1994, after which it significantly jumps to nearly 4 million barrels/day by 1998; production then increases steadily to approximately 4 million barrels/day by 2002 and sharply to almost 5 million barrels/day by 2006, while consumption portrays a rapid, notable rise post-1998, reaching close to 5-6 million barrels/day by 2006.
Given the complexity of the image, the above description may not be entirely accurate.
Skyrocket your IELTS band score by 1-2 points in under a month with our premium plan!
Note: Both the topic and the answer were created by one of our users.
The line graph demonstrates the consumption and production of oil in china from 1982 to 2006. The units are measured in millions of oil barrels per day.
Overall, the consumption of oil has dramatically increased , while from beginning it has maintained steady level. While the production of oil has been started good after that seen sudden rose and maintained same and has slow gradual increment.
In 1982, the china has about 2.1 millions of barrels of oil production, has dramatic surge to 3 millions of barrels in 1986. After that it has remained same from 1986 to 1994 around 3 million. However, after 1994 it has gradual increase in production, where the reached approximately 3.5 millions of oil barrels per day in 2006.
The consumption of oil in china has started lower than production about 1.9 million, where it remained around 3 million from 1982 to 1990. However, it has seen a sudden rose in 1990 to 1994, where it reached around 3.5 millions of barrels. After that it has drastically increased and reached approximately 6.3 millions of oil barrels per day from 1994 to 2006.
Word Count: 187
