Our system will evaluate the answer based on this AI-generated description.
The image presents UK acid rain emissions (million tonnes) from 1990 to 2007 across four sectors: Transport and Communication, Electricity Gas and Water Supply, Domestic, and Other Industries. In 1991, emissions were approximately 3.3 (Transport and Communication), 2 (Electricity, Gas and Water Supply), 1 (Other Industries), less than 0.5 (Domestic). By 1995, these were about 2.2 (Transport and Communication), 1.5 (Electricity, Gas and Water Supply), 1 (Other Industries), less than 0.5 (Domestic). By 2000, numbers dropped to around 1.3 (Transport and Communication), 1.2 (Electricity, Gas and Water Supply), approximately 0.9 (Other Industries), and remained under 0.5 (Domestic). Finally, in 2007 levels were roughly 1 (Transport and Communication), 0.5 (Electricity, Gas and Water Supply), less than 0.5 (Other Industries), and below 0.1 (Domestic). Emissions generally show a decreasing trend across all sectors.
Given the complexity of the image, the above description may not be entirely accurate.
Skyrocket your IELTS band score by 1-2 points in under a month with our premium plan!
Note: Both the topic and the answer were created by one of our users.
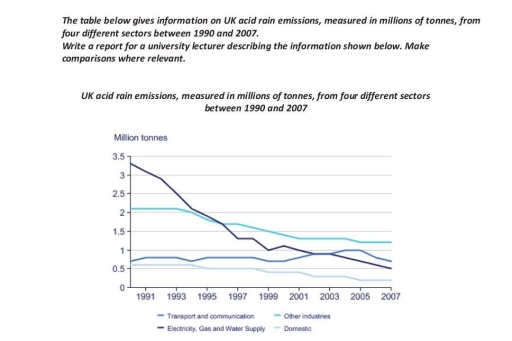
The line graph illustrates the data on acid rain emissions in the Great Britain from four areas over a 17-year period ending in 2007. Units are measured in million tons. Overall, it is clear that this emission from rain acid experienced a decline over the timeframe for all sectors, albeit with different amounts.
Regarding to electricity section, at the outset of the paragraph it stood at nearly 3.5 million tons, but by 1997 this sector had plunged to just under 1.5. In the following 4 years there was a mild fluctuation which led to another considerable decline in the end of the period. The sector devoted to other industries emitted over 2 million tons in 1990, however after 1993 they witnessed a considerable fall and evened out with almost 1 million tons.
Turning to the less considerable changes, transportation and domestic sector stood nearly to each other in 1990 with approximately half a million ton. While transport and communication first experienced a gradual increase and then came back to the first amount, there was a relatively gradual fall in the domestic part, making them the lowest amount in the end of the period.
Word Count: 193
