Our system will evaluate the answer based on this AI-generated description.
The image presents a bar chart depicting the number of jobs in tourism-related industries in a UK city from 1989 to 2009, with separate bars for restaurants, hotels, sport and leisure, and travel and tours for each year. The chart records figures for the years 1989, 1994, 1999, 2004, and 2009. The values for 1989 are as follows: restaurants with approximately 700 jobs, hotels with about 500, sports and leisure with roughly 200, and travel and tours with slightly over 100 jobs. In 1994, the job numbers increase in all sectors with restaurants at approximately 800, hotels around 600, sport and leisure at nearly 500, and travel and tours just above 300. 1999 sees a further rise: restaurants surpassing 900, hotels around 850, sport and leisure close to 750, and travel and tours at 500. In 2004, there is a mixed trend with restaurants reaching almost 1700, hotels over 700, sport and leisure around 850, but travel and tours declines to approximately 400. The final year, 2009, shows a decrease across all industries except for travel and tours which recover to around 600 jobs, while restaurants drop to just over 1400, hotels to 750, and sport and leisure to roughly 550. All trends are illustrated by multiple bars on the y-axis, rising from zero to a maximum of 1800 jobs, with each bar corresponding to a respective industry in the tourism sector.
Given the complexity of the image, the above description may not be entirely accurate.
Skyrocket your IELTS band score by 1-2 points in under a month with our premium plan!
Note: Both the topic and the answer were created by one of our users.
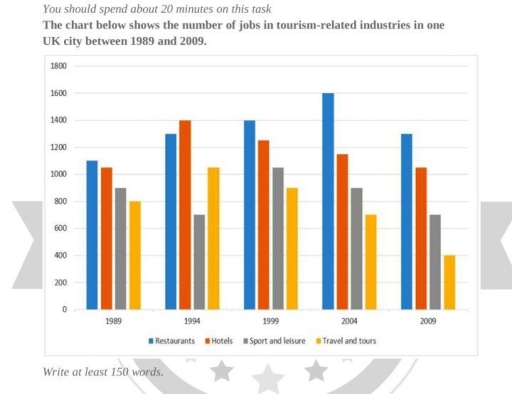
The bar graph details the number of occupations in tourism-associated industries in one the U.K town from 1989 to 2009.
Looking from an overall perspective, it is readily apparent that the jobs in two sectors grew up, while the reverse was true for restaurants and hotels, which dominated notably throughout the period.
To begin, the number of jobs in sports and leisure, and travel and tours was recorded at approximately 900 and 800, respectively. While the former experienced dramatic decrease to about 720 by 1994, the latter rose significantly to its peak (around 1080). However, those reached both growth (1080) and drop (900) in 1999. After those rates underwent marginal drop to 700 and precisely 400, respectively at the end of the period.
In contrast, the job numbers for restaurants and hotels stood at approximately 1100 and 1050, respectively, in the initial year. Restaurants witnessed notable growth to its peak (precisely 1600) by 2004, but this figure saw sudden drop to 1300 in 2009, likewise, the figure for hotels increased significantly to 1400, then this rate marginally diminished to 1080 at the end of the period.
Word Count: 186