Our system will evaluate the answer based on this AI-generated description.
The image presents a line graph depicting average house prices for Country A, Country B, and Country C from 1997 to 2014; in 1997, Country A was at $150k, Country B at $80k, Country C at $130k; by 1998, Country A increased to $180k, Country B to $100k, Country C to $135k; by 1999, Country A rose to $190k, Country B to $120k, Country C decreased to $125k; in 2000, Country A at $220k, Country B at $150k, Country C back at $130k; by 2001, Country A surged to $270k, Country B $170k, Country C at $150k; in 2002, Country A dramatically rose to $350k, Country B to $195k, Country C to $180k; by 2003, Country A reached $450k, Country B $200k, Country C $230k; in 2004, Country A hit $500k, Country B $210k, Country C $250k; by 2005, Country A dipped to $480k, Country B to $205k, Country C $260k; in 2006, Country A at $490k, Country B $180k, Country C $300k; by 2007, Country A rose again to $510k, Country B $170k, Country C $310k; in 2008, Country A grew to $540k, Country B $150k, Country C $320k; by 2009, Country A $550k, Country B $145k, Country C peaked at $400k; in 2010, Country A at $560k, Country B $130k, Country C $390k; by 2011, Country A $590k, Country B $135k, Country C $320k; in 2012, Country A grew to $600k, Country B $140k, Country C $330k; by 2013, Country A rose to $680k, Country B $150k, Country C $350k; in 2014, Country A peaked at $750k, Country B $160k, Country C $420k.
Given the complexity of the image, the above description may not be entirely accurate.
Skyrocket your IELTS band score by 1-2 points in under a month with our premium plan!
Note: Both the topic and the answer were created by one of our users.
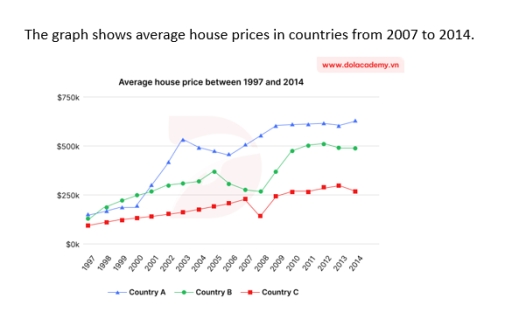
The line chart illustrates average house prices in three countries from 1997 to 2014, measured in US dollars.
Overall, Country A experienced the greatest price volatility among three coutries. In contrast, Country B showed a brief dip and Country C demonstrated a rising steadily.
At the early stages, the average house prices in Country A rose comparatively sustainable around 180K by 2000. After that, accelerating sharply from 2001 to 2003 around 510k, and then prices fluctuated between 200K and 550K in following the next years. Eventually, prices reached the highest point roughly 560K by 2014.
Country B prices depicted a increasing steadily from 170k to 330k in 2005. After, plummeted markedly around 260K by 2008 and prices surged back throught six years and hit a high of approximately 510k by 2011. But it didn’t surpassing the prices in Country A.
Meanwhile, Country C didn’t show many price changes from 1997 to 2007 around 240K. However, prices dropped modestly about 200k in 2008 and rose relatively stable for the next years.
Word Count: 170