Our system will evaluate the answer based on this AI-generated description.
The image presents a table detailing the time allocation of unemployed individuals in the UK last year, segmented into morning and afternoon for both men and women. For housework, morning men 19%, morning women 49%, afternoon men 8%, afternoon women 14%. Shopping: morning men 20%, morning women 26%, afternoon men 9%, afternoon women 17%. Job hunting: morning men 22%, morning women 26%, afternoon men 6%, afternoon women 12%. Visiting friends or relatives: morning men 6%, morning women 10%, afternoon men 12%, afternoon women 17%. Gardening: morning men 4%, morning women 9%, afternoon men 13%, afternoon women 8%. TV: morning men 19%, morning women 17%, afternoon men 14%, afternoon women 12%. Reading: morning men 6%, morning women 10%, afternoon men 12%, afternoon women 18%. Decorating: morning men 9%, morning women 4%, afternoon men 2%, afternoon women 3%. Walking: morning men 4%, morning women 3%, afternoon men 7%, afternoon women 2%. Nothing/sitting around: morning men 8%, morning women 3%, afternoon men 8%, afternoon women 4%. Staying in bed: morning men 9%, morning women 2%, afternoon men 3%, afternoon women 2%. Visiting town: morning men 4%, morning women 18%, afternoon men 1%, afternoon women 2%. Playing sport: morning men 8%, morning women 1%, afternoon men 4%, afternoon women 1%. Drinking: morning men 2%, morning women 1%, afternoon men 3%, afternoon women 1%.
Given the complexity of the image, the above description may not be entirely accurate.
Skyrocket your IELTS band score by 1-2 points in under a month with our premium plan!
Note: Both the topic and the answer were created by one of our users.
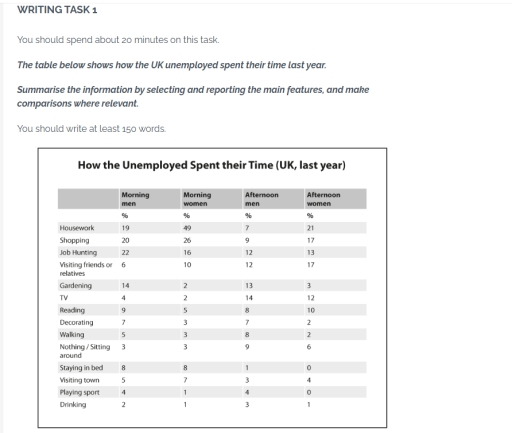
The given chart illustrates the comparison of activities done by four categories of unemployed people in United Kingdom, last year. A glance at the table reveals that everyone preferred to spend their time by doing more physical activities than staying inside all day, without doing anything. Also, people are categorised by their gender and two periods of the day.
It is interesting to note that housework activities have the biggest percent out of all data, being practiced by 49% of morning women. The statistics also show that job hunting remained constant for all of the four types of people. Its highest percentage is 22%, for morning men, and its lowest point is 13%, for afternoon women.
However, not all activities, which might be considered entertaining, are preferred for unemployed residents in the UK. Drinking and playing sport have one of the least percentage out of all table data, some of them even reaching 0% for afternoon women, such as staying in bed.
Word Count: 162