Our system will evaluate the answer based on this AI-generated description.
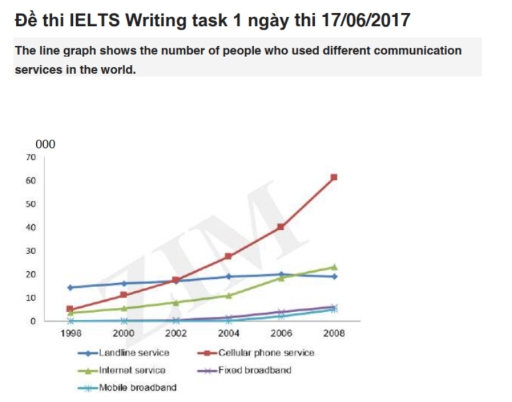
The image depicts a line graph illustrating the number of people using five communication services globally from 1998 to 2008. In 1998, landline service started at around 5 million, cellular phone service at 10 million, internet service and fixed broadband below 5 million, and mobile broadband at 0. By 2000, cellular service reached 15 million, internet service 5 million, landline around 8 million, fixed broadband slightly above 0, and mobile broadband remained absent. In 2002, cellular service rose to 30 million, landline at about 10 million, internet approaching 15 million, fixed broadband and mobile broadband each around 5 million. By 2004, cellular service sharply increased to 40 million, internet service reached approximately 30 million, landline at 12 million, fixed broadband about 10 million, and mobile broadband at 5 million. In 2006, cellular service expanded to 55 million, internet service to 40 million, landline at 15 million, fixed broadband at 18 million, and mobile broadband at 8 million. By 2008, cellular service peaked at 65 million, internet service at 50 million, landline at around 15 million, fixed broadband at 22 million, and mobile broadband at 20 million.
Given the complexity of the image, the above description may not be entirely accurate.
Skyrocket your IELTS band score by 1-2 points in under a month with our premium plan!
Note: Both the topic and the answer were created by one of our users.
The line graph gives information about the avreg of male and femals who used more than coomunication servies in the whole world during the period from 1996 to 2006.
Overall. The five communication services exhibited the same line trends except one trend over the given period, four followed an upward trajectory, whereas the showed a gradually. However, the rates of increase significantly between them.
As the graph shows, celluler phone service began at nearly 5% services in 1996, followed by a gradual increase until 2000. However, the line follow the same side to the end more than 60% in 2006.
By contrast, in the others trends avreg of male and femalemal used a lot of coomunication services started at 0% and almost 15% in 1996 then they showd the same side in the period ,but some trends saw a increase slowly in 2002. Regarding the interrot services in 2004 was drastically to more than 20% in 2006.
Word Count: 157
