Our system will evaluate the answer based on this AI-generated description.
The image presents a bar graph showing spending on international tourism in billion dollars for seven countries in 2011 and 2012. The vertical axis, labeled as spending in billion dollars, has increments of 20 from 0 to 120, while the horizontal axis lists the countries. For China, the spending depicted for 2011 is about 73 billion dollars, while for 2012 it is around 100 billion dollars. Germany's spending for 2011 is approximately 84 billion dollars and for 2012 about 83 billion dollars. The United States' spending in 2011 is roughly 79 billion dollars, and in 2012 it is close to 83 billion dollars. The United Kingdom's spending in 2011 is around 51 billion dollars and in 2012 approximately 52 billion dollars. The Russian Federation shows a spending of about 43 billion dollars in 2011 and nearly 50 billion dollars in 2012. France's spending in 2011 is close to 38 billion dollars while in 2012 it is approximately 37 billion dollars. Finally, Canada's spending is depicted at around 24 billion dollars for both 2011 and 2012.
Given the complexity of the image, the above description may not be entirely accurate.
Skyrocket your IELTS band score by 1-2 points in under a month with our premium plan!
Note: Both the topic and the answer were created by one of our users.
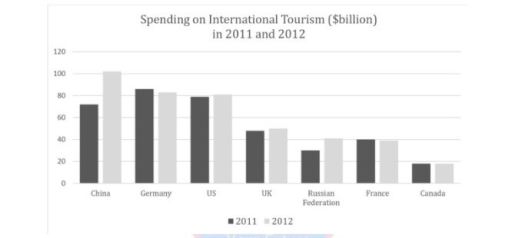
The bar chart provides information about how much money, in billions spend on global tourism by individuals from seven countries in the years 2011 and 2012.
Overall, the most significant spending is in China, whereas Canada has the least consumption for tourism in both years. Some countries show an upward trend, while others display a downward trend, and an unchanged trend throughout the period.
Looking at more detail, China consumed almost 70 billion in 2011, and in the year 2012, it sharply increased to 100 billion. Germany’s spending accounted for more than 80 million in 2011, whereas it experienced a slight decline in 2012. Moreover, the UK showed a dramatic increase between 2011 and 2012.
In the year 2011, the Russian Federation’s figures sharply rose, and it reached 40 billion in 2012. France and Canada stayed relatively constant at about 40 and 20 billion respectively in the years 2011 and 2012.
Word Count: 151