🔥 Today Only: Save 30% on Premium — Offer Ends Soon! - Upgrade Now!
Multiple Graphs

Band 6+: Anthropolgy graduates and their work after 5 years of graduating.

Image for topic: Anthropolgy graduates and their work after 5 years of graduating.
Our system will evaluate the answer based on this AI-generated description.
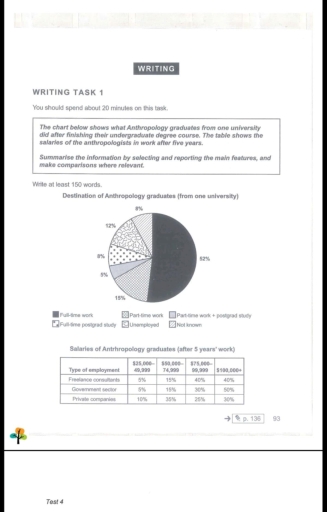
The image presents a pie chart detailing the employment status of Anthropology graduates from an unspecified university: full-time work accounts for 52%, part-time work stands at 15%, part-time work plus postgraduate study comprises 5%, full-time postgraduate study makes up 8%, unemployment is at 8%, and those not specified are 12%. Accompanying this is a table displaying salaries of Anthropology graduates five years post-graduation, segmented by type of employment and salary range: $25,000-$49,999 (Government sector 50%, Private companies 40%, Freelance consultants 5%), $50,000-$74,999 (Government sector 30%, Private companies 25%, Freelance consultants 15%), $75,000-$99,999 (Government sector 10%, Private companies 25%, Freelance consultants 40%), and $100,000+ (Government sector 10%, Private companies 10%, Freelance consultants 40%).
Given the complexity of the image, the above description may not be entirely accurate.
Note: Both the topic and the answer were created by one of our users.

The provided graph manifests what the students who gratuated of Anthropology program from one university did after graduating and finishing this course degree. In addition, the given table demonstrates the income of the anthropolgists in their jobs after 5 years.

Generally, after analyzing this chart, it can be seen that the largest percentage of graduates has a full-time work. On the other hand, the anthropoligists that have part-time work + postgrad study are the least percentage.

Furthermore, the analysis of the table shows the salaries of the graduating students after 5 years’ work. To illustrate, there is a similarity in the percentages of people who work as Freelance consultants and Governement sector and earn both $25,000-49,999 and $50,000-99,999 which are 5% and 15% respectively.

Additionally, the number of workers who earn $100,000+ is triple of the individuals who earn $25,000-49,999. Moreover, the highest paid job which pay $100,000+ is spread at all types of the employment, but the highest is in the Goernement sector.

Word Count: 164

Answers On The Same Topic:

Anthropolgy graduates and their work after 5 years of graduating.

→The pie chart illustrates the students who graduated of Anthropology graduaks from one university did after finishingrompleting a degree course. The given table demonstrates the income of anthropologists in their jobs after five years! overall. After analyzing this chart, it can be seen that full time worker has largest percentage of graduaks. the anthropologist have […]

Anthropolgy graduates and their work after 5 years of graduating.

The chart illustrates the anthropology graduates from one university did after finishing their under graduate degree course. The table depicts the salaries of the anthropologist in work after five years. Overall, around 52% of graduates from anthropology doing full time employment and 12% of people facing unemployment. In additionally the salaries of graduates mainly from […]

Anthropolgy graduates and their work after 5 years of graduating.

The diagram illustrates what Anthropology graduates from one college did after finishing their bachelor’s degree course. The table demonstrates the income of the anthropologists in work after five years. Overall, most graduates began to work after finishing their university, and highest earners are those who work for the government and self-employed ones. The largest percentage […]

See All

Other Topics:

The pie charts below show the percentage of five kinds of books sold by a bookseller between 1972 and 2012. Summarise the information by selecting and reporting the main features, and make comparisons where relevant.

The three pie charts illustrate the proportion of five different types of books – Adult fiction, Children’s fiction, Biography, Travel and others – sold by a bookseller over a 40-year period : from 1972 to 2012. Overall, Adult fiction accounted for the highest proportions of books sold towards the end of the period, whereas biography […]

The chart shows the jobs of men and women in 2005 and 2015.

The given chart illustrates the occupations of males and females, in 2005 and 2015 Overall,presented tables shows 5 types of occupations:Vice Presidents,Directors,Managers,Analysts,Administrators. Category “Vice Pesidents” is equal in gender in 2015 however in 2005 males were mainly chosen on that postion After that Category “Directors” presents us that in 2015 females are more enthusiastic to […]

The charts below give information on the ages of people when they got married in one particular country in 1996 and 2008.

The bar charts compare the percentage of people who got married in six distinct age brackets in 1996 and 2008. Overall, the proportion of females getting married experienced a slight decrease, apart from people aged 25-29, while that of men in 30-34 and 35-39 increased considerably. Noticeably, the percentage of married men in the last […]

The chart and table below show the results of a survey of library users at university.

The pie chart illustrates the proportions of five different categories of library users, while the table details user satisfaction levels regarding five specific library services. Overall, full-time students account for the vast majority of library users, with full-time undergraduates comprising the largest single demographic. Regarding service quality, overall satisfaction is exceptionally high across all categories, […]

The charts below show the average number of hours people in different age groups spent per day on four activities in 2000 and 2020. Summarise the information by selecting and reporting the main features, and make comparisons where relevant.

The bar charts illustrate the average number of hours people in various age groups spent per day on four activities, namely work or study, leisure, household chores, and socializing, in 2000 and 2020. Overall, the average speding time on work or study is the highest in both years among all age groups with people in […]

Task 1: The two bar charts show the proportion of 14-16-year-old students studying a modern foreign language in an English-Speaking country and the top three popular foreign languages. Summarise the information by selecting and reporting the main features, and make comparison where relevant.

The two bar graphs depict the percentages of students aged 14 to 16 studying a modern foreign language in an English-speaking country, as well as the proportions of students studying the three most popular foreign languages between 1984 and 2007. Overall, the proportion of female students was higher than that of boys throughout the entire […]

See All
We have detected unusual activity on your device.
Please verify your identity to continue.
Note: This verification step won't sign you in. If you have a premium account, please log in to access the service as usual.
Google/Gmail Verification
Or verify using Email/Code
We've sent a verification code to:
youremail@gmail.com (Not your email?)
Enter it below to complete the verification process.
Ensure your email address is correct, your inbox is not full, and you check your spam folder. If no email arrives, consider using an alternative email.
You will need a Premium plan to perform your action!
Note: If you already have a premium account, please log in to access our services as usual.

Plans & Pricing

Our mission is to make quality education accessible for everyone.
However, to keep our hardworking team running and this service alive, we genuinely need your support!
By opting for a premium plan, not only do you sustain us in achieving the mission, but you also unlock advanced features to enrich your learning experience.

Free

For learners who aren't pressed for time

What's included on Free
100+ Cambridge IELTS Tests
Instant IELTS Writing Task 1 & 2 Evaluation (2 times/month)
Instant IELTS Speaking Part 1, 2, & 3 Evaluation (2 times/month)
Instant IELTS Writing Task 1 & 2 Essay Generator (2 times/month)
500+ Dictation & Shadowing Exercises
100+ Pronunciation Exercises
Flashcards
Other Advanced Tools

Premium

For those serious about advancing their English proficiency, and for IELTS candidates aspiring to boost their band score by 1-2 points (especially in writing & speaking) in just 30 days or less

What's included on Premium
Save Your IELTS Test Progress & Analyze Mistakes By Question Type
Save Your Own Flashcard Sets & Use Them On Any Device
Unlock All Courses, IELTS Tests, Section & Part Practice
Unlimited AI Conversations
Unlimited AI Writing Enhancement Exercises
Unlimited IELTS Writing Task 1 & 2 Evaluation
Unlimited IELTS Speaking Part 1, 2, & 3 Evaluation
Checked Answers Will Not Be Published
Unlimited IELTS Writing Task 1 & 2 Essay Generator
Unlimited IELTS Speaking Part 1, 2, & 3 Sample Generator
Unlimited Usage Of Advanced Tools & AI Features
Priority Support within 24h (12-month plan only)

Due to the nature of our service and the provided free trials, payments are non-refundable.