🔥 Today Only: Save 30% on Premium — Offer Ends Soon! - Upgrade Now!
Table

Band 5+: Percentage of Activities Done By Unemployed People in the UK

Image for topic: Percentage of Activities Done By Unemployed People in the UK
Our system will evaluate the answer based on this AI-generated description.
The image presents a table illustrating how the unemployed in the UK spent their time last year broken down by morning, afternoon, and evening for both men and women. For men: Housework had 11 in mornings, 18 in afternoons, and 19 in evenings; Shopping, 6 - morning, 10 - afternoon, 8 - evening; Job hunting/searching, 20 - morning, 16 - afternoon, 17 - evening; Visiting friends/family, 12 - morning, 10 - afternoon, 15 - evening; TV-watching, 18 - morning, 16 - afternoon, 14 - evening; Gardening, 14 - morning, 13 - afternoon, 12 - evening; DIY, each 11; Leisure/active sport, 10 - morning, 12 - afternoon, 9 - evening; Relaxing, 10 - morning, 9 - afternoon, 8 - evening; Walking/dog, 5 - morning, 6 - afternoon, 5 - evening; Eating/personal care, consistently with 5; Drinking, 3 - morning, 7 - afternoon, 10 - evening. Women: Housework - 16 morning, 19 afternoon, 17 evening; Shopping - 20 morning, 16 afternoon, 14 evening; Job hunting/searching - 5 morning, 4 afternoon, 3 evening; Visiting friends/family - 5 morning, 8 afternoon, 12 evening; TV-watching - 13 morning, 18 afternoon, 17 evening; Gardening - 9 morning, 5 afternoon, 4 evening; DIY - 5 consistently; Leisure/active sport - 2 morning, 8 afternoon, 5 evening; Relaxing - 8 morning, 7 afternoon, 5 evening; Walking/dog - 8 morning, 6 afternoon, 9 evening; Eating/personal care - 3, 4, 5 respectively; Drinking - 2 morning, 4 afternoon, 6 evening.
Given the complexity of the image, the above description may not be entirely accurate.
Note: Both the topic and the answer were created by one of our users.

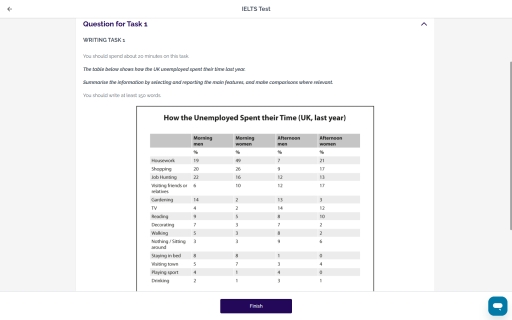
The table shows the data about how unemployed man and women in the UK used their time in the last year. Overall, there were different ways of spending time based on each genre of them in the morning. Though, they both started being more active in the afternoon.

As can be seen from the table, there were data about some ways of how people who looked for jobs in the UK spend the time since morning to afternoon in the last year. The provided data was devided by gender: man and woman.

Based on the table, most women accounted for 49% started the day by doing housework, while around 22% of man would do job hunting first in the morning. In the morning, the least activity done by man and woman were drinkring and only sitting around.

As afternoon came, there were some activities done by most man: watching television, gardening, seeking for jobs, or seeing friends or relatives. In the other side, the jobless woman would love to use their afternoon by working on housework, shopping, visiting friends or families, or hunting a job like some men did.

Word Count: 189

Answers On The Same Topic:

Percentage of Activities Done By Unemployed People in the UK

The chart below illustrates the vary in a proprietorship of electrical appliances and quantity of time spent doing housework in households in one country among 1920 and 2019. Overall, two graphs were disputed.Percentage of households with electrical applicants compared with number of hours of housework, (such as washing clothes, preparing meals and cleaning )per week, […]

See All

Other Topics:

The tables below give information about the consumption and production of potatoes in different world regions in 2006. Summarize the information by selecting and reporting the main features, and make comparisons where relevant.

The tables compare potato consumption and production across five regions of the world in 2006, measured in kilograms per person and tonnes respectively. Overall, Europe recorded by far the highest level of potato consumption, while Africa consumed the least. In contrast, Asia/Oceania was the largest producer of potatoes, despite having relatively modest consumption levels compared […]

The table below gives average yearly weather statistics of four cities.

The given table shows the annual weather statistics in Edinburgh, Paris, Helsinki and Casablanca, comparing the amount of rainfall, wet days, snowfall, temperature, and sunlight hours. Overall, it can be seen that Paris experiences the most rainfall, Helsinki has the most wet days and snowfall, while Casablanca is much hotter and drier than the other […]

The number of international tourists visiting some areas of the world

The table discribes the figures for foreign tourists arriving in six areas around the world and the yearly development rate between 1995 and 2020. Overall, the common trend in the number of visitors in six areas experienced an upward trend, and Europe and American countries had the largest number of overseas tourists. In addition, other […]

The percentage of households with electronic goods in New Zealand

The table presents data on the percentage of New Zealand households owning various electronic goods in 2002 and 2020. Overall, washing machine ownership remained stable across both years, while video recorder usage declined noticeably. In contrast, most other goods saw upward trends, with digital cameras and cell phones recording the most dramatic increases. Washing machines […]

The table below shows the percentage of men and women employed in four different types of industries in one twon in 1990, 2000, and 2010. Summarize the information by describing the main features of the charts and making comparisons where appropriate.

The table provides date on two different genders being employed across various industries in 2 decades starting from 1990. Overall, table illustrates the various degrees of increases and decreases in both genders and also there is a sector that remained unchanged during a timeframe.Notably,among men workers manufacturing is the most popular workplace while reverse was […]

the table illustrates the alteration in demographic numbers of six large cities in 2017 and 2018

The provided table clearly depicts the main demographic shifts in six major cities,highligthing their population figures for 2017 and 2018 along with the subsequent changes. Overall,it can be seen that Delhi experienced significant increase over the given period,while the other five cities showed smaller rises. In 2017,Delhi had the highest population at 27 million,which increased […]

See All
We have detected unusual activity on your device.
Please verify your identity to continue.
Note: This verification step won't sign you in. If you have a premium account, please log in to access the service as usual.
Google/Gmail Verification
Or verify using Email/Code
We've sent a verification code to:
youremail@gmail.com (Not your email?)
Enter it below to complete the verification process.
Ensure your email address is correct, your inbox is not full, and you check your spam folder. If no email arrives, consider using an alternative email.
You will need a Premium plan to perform your action!
Note: If you already have a premium account, please log in to access our services as usual.

Plans & Pricing

Our mission is to make quality education accessible for everyone.
However, to keep our hardworking team running and this service alive, we genuinely need your support!
By opting for a premium plan, not only do you sustain us in achieving the mission, but you also unlock advanced features to enrich your learning experience.

Free

For learners who aren't pressed for time

What's included on Free
100+ Cambridge IELTS Tests
Instant IELTS Writing Task 1 & 2 Evaluation (2 times/month)
Instant IELTS Speaking Part 1, 2, & 3 Evaluation (5 times/month)
Instant IELTS Writing Task 1 & 2 Essay Generator (2 times/month)
500+ Dictation & Shadowing Exercises
100+ Pronunciation Exercises
Flashcards
Other Advanced Tools

Premium

For those serious about advancing their English proficiency, and for IELTS candidates aspiring to boost their band score by 1-2 points (especially in writing & speaking) in just 30 days or less

What's included on Premium
Save Your IELTS Test Progress
Unlock All Courses & IELTS Tests
Unlimited AI Conversations
Unlimited AI Writing Enhancement Exercises
Unlimited IELTS Writing Task 1 & 2 Evaluation
Unlimited IELTS Speaking Part 1, 2, & 3 Evaluation
Checked Answers Will Not Be Published
Unlimited IELTS Writing Task 1 & 2 Essay Generator
Unlimited IELTS Speaking Part 1, 2, & 3 Sample Generator
Unlimited Usage Of Advanced Tools
Priority Support within 24h (12-month plan only)

Due to the nature of our service and the provided free trials, payments are non-refundable.
Nếu bạn là người Việt Nam và không có hoặc không muốn trả bằng credit/debit cards, bạn có thể thanh toán bằng phương thức chuyển khoản:


Chọn gói:
419,000₫ 277,000 ₫ cho gói 1 tháng (chỉ 9,233₫/ngày)
1,239,000₫ 597,000 ₫ cho gói 3 tháng (chỉ 6,633₫/ngày)
2,469,000₫ 1,027,000 ₫ cho gói 6 tháng (chỉ 5,706₫/ngày)
4,929,000₫ 1,417,000 ₫ cho gói 12 tháng (chỉ 3,936₫/ngày)


Sau khi chuyển khoản, vui lòng đợi trình duyệt tự động điều hướng bạn trở lại Engnovate và bạn sẽ ngay lập tức nhận được mã kích hoạt tài khoản premium.
Nếu có lỗi xảy ra, bạn có thể liên hệ với team thông qua một trong các phương thức: email đến helloengnovate@gmail.com hoặc nhắn tin qua facebook.com/engnovate.
Vì toàn bộ công cụ trên website đều có thể sử dụng thử miễn phí, Engnovate không hỗ trợ hoàn tiền.