Our system will evaluate the answer based on this AI-generated description.
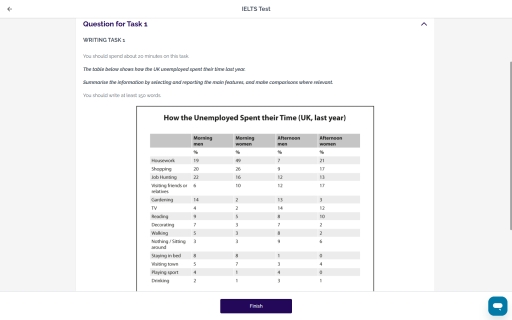
The image presents a table illustrating how the unemployed in the UK spent their time last year broken down by morning, afternoon, and evening for both men and women. For men: Housework had 11 in mornings, 18 in afternoons, and 19 in evenings; Shopping, 6 - morning, 10 - afternoon, 8 - evening; Job hunting/searching, 20 - morning, 16 - afternoon, 17 - evening; Visiting friends/family, 12 - morning, 10 - afternoon, 15 - evening; TV-watching, 18 - morning, 16 - afternoon, 14 - evening; Gardening, 14 - morning, 13 - afternoon, 12 - evening; DIY, each 11; Leisure/active sport, 10 - morning, 12 - afternoon, 9 - evening; Relaxing, 10 - morning, 9 - afternoon, 8 - evening; Walking/dog, 5 - morning, 6 - afternoon, 5 - evening; Eating/personal care, consistently with 5; Drinking, 3 - morning, 7 - afternoon, 10 - evening. Women: Housework - 16 morning, 19 afternoon, 17 evening; Shopping - 20 morning, 16 afternoon, 14 evening; Job hunting/searching - 5 morning, 4 afternoon, 3 evening; Visiting friends/family - 5 morning, 8 afternoon, 12 evening; TV-watching - 13 morning, 18 afternoon, 17 evening; Gardening - 9 morning, 5 afternoon, 4 evening; DIY - 5 consistently; Leisure/active sport - 2 morning, 8 afternoon, 5 evening; Relaxing - 8 morning, 7 afternoon, 5 evening; Walking/dog - 8 morning, 6 afternoon, 9 evening; Eating/personal care - 3, 4, 5 respectively; Drinking - 2 morning, 4 afternoon, 6 evening.
Given the complexity of the image, the above description may not be entirely accurate.
Skyrocket your IELTS band score by 1-2 points in under a month with our premium plan!
Note: Both the topic and the answer were created by one of our users.
The chart below illustrates the vary in a proprietorship of electrical appliances and quantity of time spent doing housework in households in one country among 1920 and 2019.
Overall, two graphs were disputed.Percentage of households with electrical applicants compared with number of hours of housework,
(such as washing clothes, preparing meals and cleaning )per week, per household between from 1920 to 2019. In the first chart was seen that ,although ,there was a percent rate of household in 1920, but, it had been a hundred percent for 2,000 years, which it had the been top.In another chart, looking at the last period, number of per week shows a noticeable decrease ,as a number of per week from 50 percent in 1920 to 10 percent in 2019.
Turning the first graph, it is clear that the highest indicator would have been 30 percent in 1920. Then it continued to increase in various years. At the end, it had stopped with the peak indicators as a 100 percent in 2019. There were fewer indicators like 60 percent in 1940, 70 percent in 1960, also in 1980, it was observed decrease which it was a little over 60 percent again.
With regard to the second feature, amount of hours per week represented a substantially lowest proportion in 2019 compared to the other years. In fact, there were more than 30 rate in 1940, then it was observed changes in different years. In 1960 ,it was 20% also, 1980 and 2000 years were seen with over than 10% records. The end, the lowest indicators had been 2019.
Word Count: 263