Our system will evaluate the answer based on this AI-generated description.
The image contains two separate data visualizations. The first visualization is a pair of pie charts labeled "1995" and "2005", representing "Proportional Government Spending on the Arts" divided into four categories: Visual arts, Theatre, Music, and Literature; no specific percentage values are provided. The second visualization is a bar graph labeled "Number of People Participating in Arts Events" with the vertical axis ranging from 0 to 160,000 in increments of 20,000 and the horizontal axis listing four categories: Visual arts, Theatre, Music, and Literature. Two sets of bars represent the years 1995 and 2005. The numerical values for each category in 1995 are Visual arts approximately 42,000, Theatre approximately 75,000, Music approximately 92,000, Literature approximately 45,000. The numerical values for each category in 2005 are Visual arts approximately 98,000, Theatre approximately 150,000, Music approximately 140,000, Literature approximately 60,000.
Given the complexity of the image, the above description may not be entirely accurate.
Skyrocket your IELTS band score by 1-2 points in under a month with our premium plan!
Note: Both the topic and the answer were created by one of our users.
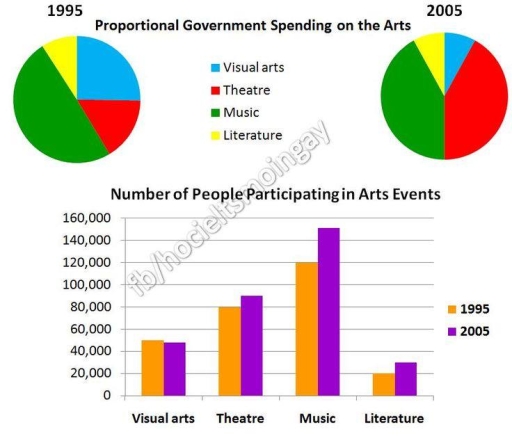
The charts above illustrate information about percentage of art forms and number of participants in various arts events in two different years; 1995 and 2005.
Overall, music was the most popular event type among all of them, in contrast events about literature was the least preferred one.
The amount of money which was spent to music events was the highest in both year, respectively, 50 percent and 45 percent. In 1995, 25 percent of money was given to visual arts, then this amount experienced a decline to 5 percent. Theatre events showed a significant growth from 20 percent to 45 percent in 2005. Money which was spent on literature events stayed constant at 5 percent in the given time period.
Number of participants at music events was 120000 and 140000, respectively, in 1995 and 2005. Theatre watchers were 80000 in 1995, then this amound increased to 85000. Parcipating in visual arts were the same nearly 41000 in both year. Literature events attracted 20000 people, after 10 years this amount reached to 30000.
Word Count: 172