Our system will evaluate the answer based on this AI-generated description.
The image contains two separate data visualizations. The first visualization is a pair of pie charts labeled "1995" and "2005", representing "Proportional Government Spending on the Arts" divided into four categories: Visual arts, Theatre, Music, and Literature; no specific percentage values are provided. The second visualization is a bar graph labeled "Number of People Participating in Arts Events" with the vertical axis ranging from 0 to 160,000 in increments of 20,000 and the horizontal axis listing four categories: Visual arts, Theatre, Music, and Literature. Two sets of bars represent the years 1995 and 2005. The numerical values for each category in 1995 are Visual arts approximately 42,000, Theatre approximately 75,000, Music approximately 92,000, Literature approximately 45,000. The numerical values for each category in 2005 are Visual arts approximately 98,000, Theatre approximately 150,000, Music approximately 140,000, Literature approximately 60,000.
Given the complexity of the image, the above description may not be entirely accurate.
Skyrocket your IELTS band score by 1-2 points in under a month with our premium plan!
Note: Both the topic and the answer were created by one of our users.
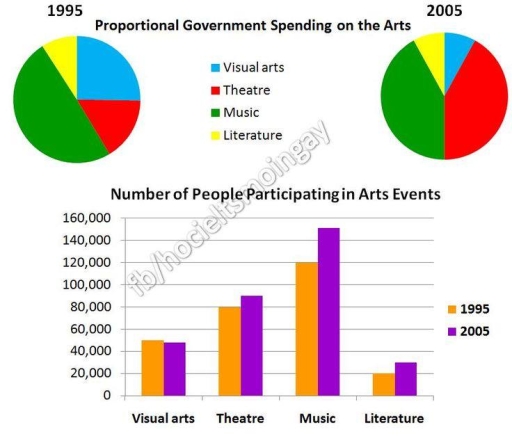
The pie charts illustrate proportional spending on the arts variation of people participating in arts events.
Overall, the music events were signficant in both years, also it dominance while other art events lost percentage of people. Despite the music, the theatre also make visual rose in the 2005, making the same size as in the music events in 2015.
The two declained arts events the literature and visual arts which were also dominance in 1995 but, in the 2005 a double declained for almost 1,000 people. However the 3 events significantly grown adding at least 1,000 people in each art.
But, there were the literature which was not rose in the end 2005 and, on the contrast they stay the same level between 1995 and 2005, while in that time the music achieved a peak in the data, having above 150,000 individuals.
Word Count: 142