Our system will evaluate the answer based on this AI-generated description.
The image displays two segments: a bar graph estimating monthly silver goods sales next year in thousands of units, increasing from January to December, and a pie chart illustrating projected market share for three entities. Bar graph details: January - Meteor Products Ltd: 200, Mark Jones Ltd: 100; February - Meteor: 300, Mark Jones: 200; March - Meteor: 400, Mark Jones: 300; April - Meteor: 500, Mark Jones: 400; May - Meteor: 500, Mark Jones: 450; June - Meteor: 550, Mark Jones: 500; July - Meteor: 600, Mark Jones: 600; August - Meteor: 650, Mark Jones: 700; September - Meteor: 700, Mark Jones: 750; October - Meteor: 750, Mark Jones: 800; November - Meteor: 800, Mark Jones: 850; December - Meteor: 900, Mark Jones: 850. Pie chart details: Meteor Products Ltd holds 50% market share, Mark Jones Ltd holds 30%, Others hold the remaining 20%.
Given the complexity of the image, the above description may not be entirely accurate.
Skyrocket your IELTS band score by 1-2 points in under a month with our premium plan!
Note: Both the topic and the answer were created by one of our users.
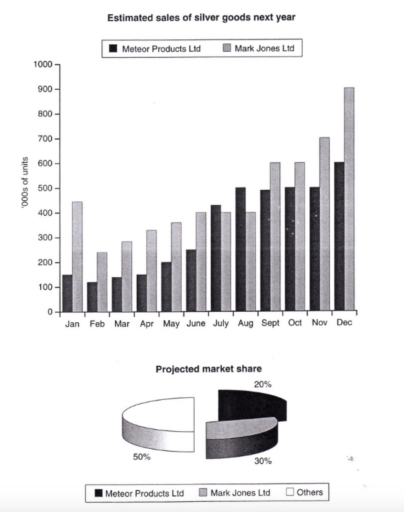
The graph illustrates predicted national sales of silver goods for two companies- Mark Jones Ltd and Meteor Products Ltd- by the end of the following year. The pie shart demonstrates each company’s projected market share till next year.
Overall, the total sales for both companies are expected to rise dramatically by december. Mark Jones Ltd sales will experience a sharp decline in Feburary, and then continue to grow steadily till december. By the end of the period, Mark Jones will have the upper hand in marketing. The pie graph provides information on each company’s portion in market share.
Meteor Products show a drastic and continuous upward trend, starting from an initial sale of approximately 150 ‘000s of units in the first month and ending up with 600 by the end of period. Mark Jones company experienced a notciable drop of 200 ‘000s of units in the first month and then rose significantly by december. Even though Mark Jones experienced a huge dip in their sales, they end up having more final sales than Meteor Products. The market share is predicted to be 30% for Mark Jones, 20% Meteor products and the remaining 50% for other companies.
Word Count: 196