Our system will evaluate the answer based on this AI-generated description.
The image presents a bar chart comparing the number of houses built per year in two cities, Derby and Nottingham, from 2000 to 2009. In 2000, Derby had about 100 houses built, while Nottingham had about 50. In 2001, the number of houses built in Derby was just over 50, and Nottingham also built about 50 houses. Derby's numbers increased to almost 100 in 2002, whereas Nottingham's construction dropped below 50. 2003 shows a rise for both cities, with Derby reaching 150 houses and Nottingham surpassing 50. From 2004 to 2006, Derby's construction fluctuated around 150 houses annually, while Nottingham steadily increased from about 50 to nearly 150. In 2007, Derby built about 175 houses, Nottingham slightly fewer than 150. The year 2008 exhibited a significant increase in construction activity, Derby reaching about 200 houses, and Nottingham seeing an impressive jump to approximately 350 houses. The final year, 2009, Derby maintained around 200 houses, while Nottingham slightly decreased its construction to around 300 houses.
Given the complexity of the image, the above description may not be entirely accurate.
Skyrocket your IELTS band score by 1-2 points in under a month with our premium plan!
Note: Both the topic and the answer were created by one of our users.
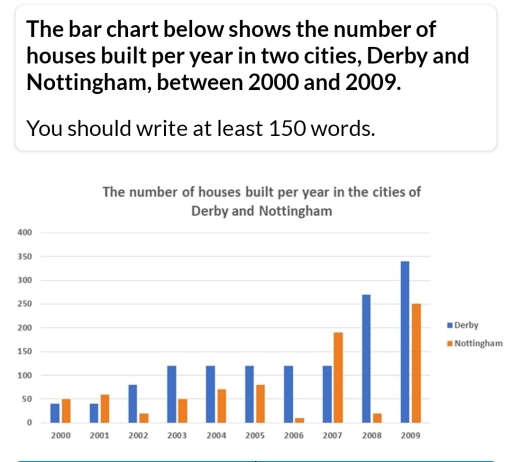
The bar chart illustrates the annually contructed houses number of two cities Derby and Nottingham , over the period from 2000 to 2009.
Overall, the built houses number in Derby higher than as compared to Nottingham .
Another interesting point that should be highlighted, in Derby number of houses gradually increased throughout the period whereas, Nottingham show flautating trend.
look at the Derby chart, in 2000 and 2001 , there were just below 50 houses , afterthat it increased to approximately 80 houses in 2002 before it remained steadily until 2007 at above 100 houses . In 2008 housing rate reached massive resurging to around 275 and it grew up to 350 houses in 2009.
In Nottingham, there were built 50 and just above 50 houses in 2000 and 2001 ,respectively and suddenly fell to approximately 25 houses in 2002. However, from 2003 to 2005 , the rate of housing gradually increased , before plumming to lowest number just ten in 2006. Furthermore, it soured to just below 200 in 2007 before reaching level of 2006. Following that shotup to their maximum number in 2009.
Word Count: 185
