Our system will evaluate the answer based on this AI-generated description.
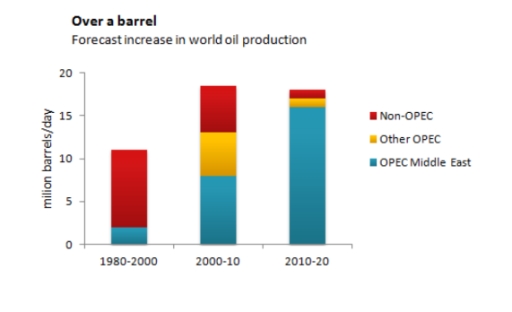
The image shows a bar graph titled 'Over a barrel' with forecasted increases in world oil production for three time periods: 1980-2000, 2000-10, and 2010-20. Three categories of oil-producing regions are represented in each bar: Non-OPEC, Other OPEC, and OPEC Middle East. The y-axis measures million barrels/day in increments of 5, from 0 to 20. From 1980-2000, Non-OPEC production increased by approximately 6 million barrels/day, Other OPEC by roughly 2 million barrels/day, and OPEC Middle East by about 3 million barrels/day. In 2000-10, Non-OPEC production saw an increase close to 4 million barrels/day, Other OPEC approximately 2 million barrels/day, and OPEC Middle East around 8 million barrels/day. For 2010-20, Non-OPEC is predicted to increase by nearly 4 million barrels/day, Other OPEC by approximately 1 million barrels/day, and OPEC Middle East by close to 7 million barrels/day.
Given the complexity of the image, the above description may not be entirely accurate.
Skyrocket your IELTS band score by 1-2 points in under a month with our premium plan!
Note: Both the topic and the answer were created by one of our users.
The given chart provides information about the amount of consumption of the world’s oil, comparing OPEC and non-OPEC nations in three different period(1980 to 2000, 2000 to 2010, 2010 to 2020)
Overall, on the onset, it is clearly seen that non-OPEC countries consume most figure from 2010 to 2020. Moreover,the largest graph appeared between 2000 and 2010.
To begin with, between 1980and 2000, the total amount of oil production was about 12 barrels, contributing to most figure in Other OPEC countries, which was approximately 10 barrel. However, Non-OPEC and OPEC Middle East nations recorded only a few increases rather than Non-OPEC ones.
Regarding from 2000 to 2010, all nations showed the similar data, which was that the figure for Non-OPEC and OPEC Middle East countries escalated during a decade. The amount of them increased around 5 barrels and 7 barrels, respectively. However, the data for Other OPEC decreased, comparing to between 1980 and 2000.
In 2010 and 2020, the production of Non-OPEC depicted a dramatic jump, which increased over 10 barrels. In contrast, the figure for OPEC Middle East and Other OPEC dropped significantly, showing 1 barrel, respectively.
Word Count: 188