🔥 Today Only: Save 30% on Premium — Offer Ends Soon! - Upgrade Now!
Bar Chart

Band 5+: The bar chart below shows the results of a survey conducted by a personnel department at a major company. The survey was carried out on two groups of workers: those aged from 18-30 and those aged 45-60, and shows factors affecting their work performance.

Image for topic: The bar chart below shows the results of a survey conducted by a personnel department at a major company. The survey was carried out on two groups of workers: those aged from 18-30 and those aged 45-60, and shows factors affecting their work performance.
Our system will evaluate the answer based on this AI-generated description.
The image is a horizontal bar graph titled "Factors affecting work performance," with two age groups: 18-30 (dark blue) and 45-60 (light blue). For 18-30 age group, the percentages for each factor are as follows: Team spirit (100), Chance for personal development (80), Relaxed working environment (70), Competent boss (58), Job security (52), Respect from colleagues (50), Promotion prospects (45), Job satisfaction (40), Work environment (38), Money (30). For 45-60 age group, the percentages for each factor are: Team spirit (100), Chance for personal development (90), Relaxed working environment (82), Competent boss (60), Job security (55), Respect from colleagues (42), Promotion prospects (38), Job satisfaction (36), Work environment (32), Money (25). The scale at the bottom ranges from 0-100. Both age groups have the same top three factors in the same order, and both groups rate 'Money' the lowest.
Given the complexity of the image, the above description may not be entirely accurate.
Note: Both the topic and the answer were created by one of our users.

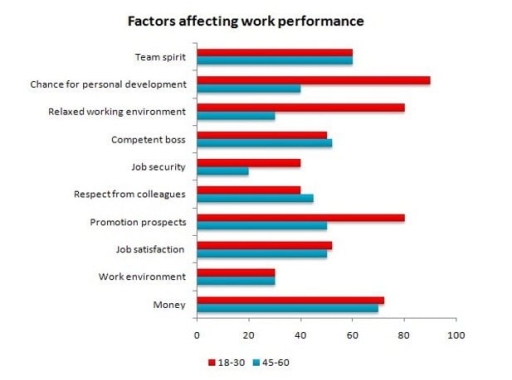
The bar chart illustrates the differences in which work performance is affected by on 2 groups of people: who in 18 to 30 years old and who in 45 to 60 years old.

Overall, the percentage in the 45 to 60 years old group is lower than that in those aged 18 – 30. While the reason of chance for personal development is the most common factor for those in 18 to 30 years old, the older group are worried most about the money.

Nearly 90% of people aged from 18 to 30 believe that the chance for personal development affects their work performances, which is over 2 times of that in the 45 to 60 years old group. Younger people also consider the relaxed working environment and promotion prospects as the second highest factors that affect their performances, at the figure of 80%, which is distantly followed by the other group.

Both groups share the same opinion on numerous factors. Particularly, about 70% people of 2 groups agree that money affects their work performances. This is the highest percentage for the older group. On the other hand, work environement affects only 30% of people in each group, which is one of the lowest figure.

Word Count: 205

Answers On The Same Topic:

The bar chart below shows the results of a survey conducted by a personnel department at a major company. The survey was carried out on two groups of workers: those aged from 18-30 and those aged 45-60, and shows factors affecting their work performance.

The bar chart compares factors influencing work performance among employees aged 18-30 and 45-60, based on a survey conducted by a company’s personnel department. Overall, younger workers prioritized career growth elements, such as development opportunities and promotions, whereas older employees valued stability and interpersonal respect. Money was important to both groups, though more so for […]

The bar chart below shows the results of a survey conducted by a personnel department at a major company. The survey was carried out on two groups of workers: those aged from 18-30 and those aged 45-60, and shows factors affecting their work performance.

The horizontal bar graph titled ‘Factors Affecting Work Performance’ illustrates the impact of various workplace elements on two distinct age demographics: individuals aged 18-30 years and those aged 45-60 years. A comparative analysis reveals consistent priorities between the two age groups, with both segments emphasizing the significance of team spirit, opportunities for personal development, and […]

The bar chart below shows the results of a survey conducted by a personnel department at a major company. The survey was carried out on two groups of workers: those aged from 18-30 and those aged 45-60, and shows factors affecting their work performance.

The supplied bar graph compares various factors that influence the work performance of two different age groups. According to the survey presented in the bar chart, both age groups, 18-30 and 45-60, experience similar effects of team spirit on work performance, both registering just over 60%. However, the opportunity for personal development significantly benefits the […]

The bar chart below shows the results of a survey conducted by a personnel department at a major company. The survey was carried out on two groups of workers: those aged from 18-30 and those aged 45-60, and shows factors affecting their work performance.

The bar chart delineates the findings of a survey aimed at identifying the factors that impact work performance across two distinct age groups: 18–30 and 45–60 years. It is evident that while financial considerations serve as a universal motivator, younger employees are predominantly motivated by opportunities for professional development, in contrast to their older counterparts, […]

See All

Other Topics:

write a report for a university lecturer describhing the information shown in the graph

The graph illustrates the proportion of men and women working in executive positions with their grade level,A being the highest and E the lowest, between July 1993 and June 1994 in ACME Oil Company. Overall, it can be said that while men’s percentages of employees excelerated as the office grade increased, women’s trend contrasted their […]

The bar graph shows where people frequently saw an advertisement for a particular holiday destination in 2020. Summarise the information by selecting and reporting the main features and make comparisons where relevant.

The bar chart compares the most popular sources for advertising a specific holiday destination in 2020. The data is measured in thousands of people. Overall, in terms of television, the proportion of older people seeing this advertisement held the dominant category, while the amount of younger individuals registered the lowest figure. Additionally, relatively similar pattern […]

The bar chart below shows the estimated percentage of car trips taken by drivers in 2005. Summarize the information by selecting the main key feature and make comparison where relevant

The given bar chart illustrates the information about the ratio of car usage for different sorts of purposes for male and female drivers during the year of 2005. Overall, it is clear that both male and female were less went for other purposes except going for work. Men were more likely to go for work […]

The graph below shows the numbers of male and female research students studying six computer science subjects at a US university in 2011.

The bar chart illustrates the both genders at a US university offers a research in six computer science subjects in 2011. Looking from an overall perspective, it is evident that comparing to the woman, men provide a highest amount of data over the year. Furthermore, most of the female students struggling with mathematics. According to […]

The chart below shows the expenditure of two countries on customer goods in 2010.

The bar chart illustrates data about the spend of consumer goods in France and UK in 2010. Overall, UK had spent more on cars, books, and cameras than France. In contrast, computers and perfume had the higher demand in France. UK distributed a large number of expenditure in cars, books, and cameras, approximately 450,000 pounds, […]

The bar chart gives information about the percentage of car trips made by male and female drivers

The given bar chart illustrates the changes in the proportion of car trips by purpose(courses, visiting town, bank, running errands, visiting friends, recreation, work and shopping) and genders of drivers in 2015. Generally speaking, it is clear that the percentage of work is significantly high whether women or men this year. Firstly, the majority of […]

See All
We have detected unusual activity on your device.
Please verify your identity to continue.
Note: This verification step won't sign you in. If you have a premium account, please log in to access the service as usual.
Google/Gmail Verification
Or verify using Email/Code
We've sent a verification code to:
youremail@gmail.com (Not your email?)
Enter it below to complete the verification process.
Ensure your email address is correct, your inbox is not full, and you check your spam folder. If no email arrives, consider using an alternative email.
You will need a Premium plan to perform your action!
Note: If you already have a premium account, please log in to access our services as usual.

Plans & Pricing

Our mission is to make quality education accessible for everyone.
However, to keep our hardworking team running and this service alive, we genuinely need your support!
By opting for a premium plan, not only do you sustain us in achieving the mission, but you also unlock advanced features to enrich your learning experience.

Free

For learners who aren't pressed for time

What's included on Free
100+ Cambridge IELTS Tests
Instant IELTS Writing Task 1 & 2 Evaluation (2 times/month)
Instant IELTS Speaking Part 1, 2, & 3 Evaluation (5 times/month)
Instant IELTS Writing Task 1 & 2 Essay Generator (2 times/month)
500+ Dictation & Shadowing Exercises
100+ Pronunciation Exercises
Flashcards
Other Advanced Tools

Premium

For those serious about advancing their English proficiency, and for IELTS candidates aspiring to boost their band score by 1-2 points (especially in writing & speaking) in just 30 days or less

What's included on Premium
Save Your IELTS Test Progress
Unlock All Courses & IELTS Tests
Unlimited AI Conversations
Unlimited AI Writing Enhancement Exercises
Unlimited IELTS Writing Task 1 & 2 Evaluation
Unlimited IELTS Speaking Part 1, 2, & 3 Evaluation
Checked Answers Will Not Be Published
Unlimited IELTS Writing Task 1 & 2 Essay Generator
Unlimited IELTS Speaking Part 1, 2, & 3 Sample Generator
Unlimited Usage Of Advanced Tools
Priority Support within 24h (12-month plan only)

Due to the nature of our service and the provided free trials, payments are non-refundable.
Nếu bạn là người Việt Nam và không có hoặc không muốn trả bằng credit/debit cards, bạn có thể thanh toán bằng phương thức chuyển khoản:


Chọn gói:
419,000₫ 277,000 ₫ cho gói 1 tháng (chỉ 9,233₫/ngày)
1,239,000₫ 597,000 ₫ cho gói 3 tháng (chỉ 6,633₫/ngày)
2,469,000₫ 1,027,000 ₫ cho gói 6 tháng (chỉ 5,706₫/ngày)
4,929,000₫ 1,417,000 ₫ cho gói 12 tháng (chỉ 3,936₫/ngày)


Sau khi chuyển khoản, vui lòng đợi trình duyệt tự động điều hướng bạn trở lại Engnovate và bạn sẽ ngay lập tức nhận được mã kích hoạt tài khoản premium.
Nếu có lỗi xảy ra, bạn có thể liên hệ với team thông qua một trong các phương thức: email đến helloengnovate@gmail.com hoặc nhắn tin qua facebook.com/engnovate.
Vì toàn bộ công cụ trên website đều có thể sử dụng thử miễn phí, Engnovate không hỗ trợ hoàn tiền.