Our system will evaluate the answer based on this AI-generated description.
The image presents a bar chart with the top ten countries for production and consumption of electricity in 2014, ranking from 1 to 10. The chart has two different types of bars representing production (billion kWh) and consumption (billion kWh) for each country. For China, production is at 5,398 and consumption is at 5,322. For the United States, production is at 4,089 and consumption is at 3,866. Russia's production is at 1,057 and consumption is at 1,038. Japan has a production of 936.2 and a consumption of 856.7. India's production is at 871 and consumption is at 818.8. Canada has a production of 618.9 and consumption of 499.9. France's production is at 562.2 and consumption is at 461.9. Brazil has a production of 530.7 and consumption of 455.8. Germany's production is at 526.6 and consumption is at 582.5. Lastly, the Republic of Korea has a production of 485.1 and consumption of 449.5.
Given the complexity of the image, the above description may not be entirely accurate.
Skyrocket your IELTS band score by 1-2 points in under a month with our premium plan!
Note: Both the topic and the answer were created by one of our users.
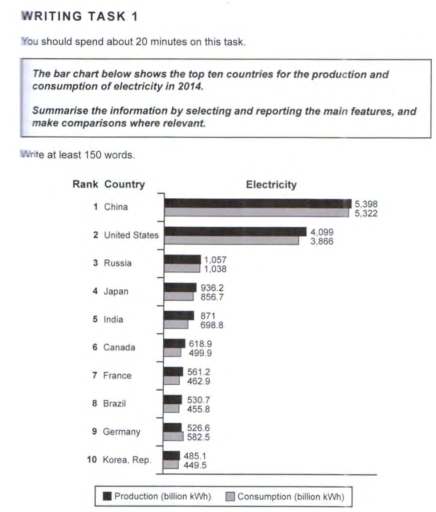
The bar chart illustrates the production and consumption of electricity across the top 10 countries in 2014.
From an overall perspective, it is clear that electricity production was highest in China, while it was lowest in the Republic of Korea.
In China, electricity production reached 5,398 billion kWh, while consumption was slightly lower at 5,322 billion kWh. Additionally, in the United States, the amount of electricity produced exceeded that consumed, with figures of 4,099 billion kWh for production and 3,866 billion kWh for consumption. Notably, in France, Brazil, and Germany, the production and consumption figures were similar, although Germany’s consumption slightly surpassed its production.
Conversely, the Republic of Korea used 449.5 billion kWh of electricity, making it the second lowest on the chart. The chart also shows that in Russia, the production and consumption figures were quite close, at 1,057 billion kWh and 1,038 billion kWh, respectively. In Japan, production was recorded at 936.2 billion kWh, while consumption was at 856.7 billion kWh. Lastly, in India, electricity production was 871 billion kWh, with consumption at 698.8 billion kWh.
Word Count: 178