Our system will evaluate the answer based on this AI-generated description.
The image depicts a bar chart illustrating sales data for different categories of games, measured in billions of dollars, from 2000 to 2006. Mobile phone games are depicted in blue, online games in red, console games in green, and handheld games in orange. In 2000, mobile phone games, online games, console games, and handheld games generated sales of approximately 0, 8, 10, and 12 billion dollars, respectively. In 2001, the corresponding figures climbed to 2, 10, 12, and 14 billion dollars. In 2002, the sales for mobile phone games soared to 4 billion, online games to 12 billion, console games slightly dipped to 11 billion, while handheld games leaped to 16 billion dollars. 2003 saw a similar trend, with mobile phone games rising to 6 billion, online games to 14 billion, console games reaching the highest peak at 18 billion, and handheld games remaining steady at 16 billion dollars. The upward trajectory continued in 2004, with mobile phone games reaching 8 billion, online games 16 billion, and both console and handheld games accruing 18 billion dollars each. By 2005, mobile phone games attained 10 billion, online games 16 billion, and both console and handheld games plateaued at 18 billion dollars. Finally, in 2006, the sales for all categories remained unchanged from the previous year.
Given the complexity of the image, the above description may not be entirely accurate.
Skyrocket your IELTS band score by 1-2 points in under a month with our premium plan!
Note: Both the topic and the answer were created by one of our users.
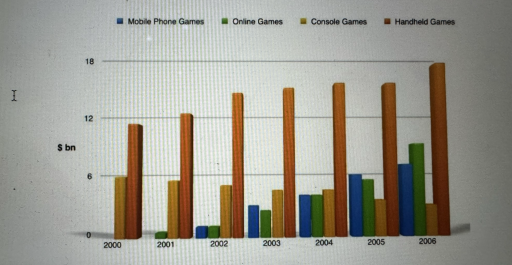
The presented bar chart illustrates the world wide sales of various types of digital games between 2000 and 2006. Units were measured in billion of dollars.
Overall, it can be seen that the most popular game over the period given was handheld game which showed highest sales throughout the time period. whereas, console game accounted for steady decline in sales. Furthermore, other persuits ( mobile phone game and online game) showed less significant rise in sales.
In terms of handheld games, this figure started at nearly $12 compared to console game ( about $ 6) in 2000. From that point, the sales for handheld games gradually rose to just above $12, nearly $14 and about $15 in 2001, 2002 and 2003 respectively before remaining stagnant to $16 in 2004 and 2005 for each. After that, this figure reached a peak of just under $18 in the final year. Whereas, the sales for console games dropped to about $3 in the final year.
On the other hand, mobile phone games and online games did not appear in 2000. In terms of mobile phone, this figure showed 0$ sales in 2001 compared to online game which still did not show any progress. After that, there was a rise in the sales of mobile phone and online game ( about $7 and almost $9 respectively) in the final year.
Word Count: 226