Our system will evaluate the answer based on this AI-generated description.
The image presents a bar chart comparing average weekly spending by families in percentages of weekly income on different categories for the years 1968 and 2018. In 1968, the expenditure percentages for various categories are as follows: Food (approximately 23%), Housing (roughly 7%), Fuel and power (close to 5%), Clothing and footwear (about 8%), Household goods (nearly 4%), Personal goods (around 2%), Transport (just over 5%), and Leisure (slightly more than 2%). For the year 2018, the spending percentages for the same categories are: Food (approximately 8%), Housing (about 30%), Fuel and power (close to 2%), Clothing and footwear (around 3%), Household goods (nearly 3%), Personal goods (approximately 3%), Transport (about 15%), and Leisure (roughly 10%). The chart illustrates a significant decrease in the percentage of income spent on food, fuel, and power from 1968 to 2018, with an increase in spending on housing, transport, and leisure in the same period.
Given the complexity of the image, the above description may not be entirely accurate.
Skyrocket your IELTS band score by 1-2 points in under a month with our premium plan!
Note: Both the topic and the answer were created by one of our users.
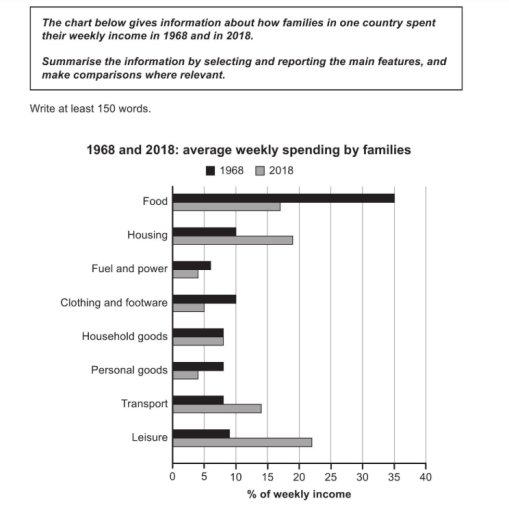
The given bar chart juxtaposes the mean weekly outlays of families in a country in 1968 and 2018.
Overall, it is clear that expenses for leisure activities and housing had a huge spike in contrast to the cost of food that took a nosedive.
It is quite interesting to note that the average spending on household goods remained identical in both the years, at around 7.5% of the weekly income. The expense in transportation hiked to approximately 14% in 2018, nearly twice the spending of 1968. Similarly, the expenditure in housing surged from 10% to just below 20% while for leisure activities it went from 9% to 22%.
In contrast, the spending reduced for fuel and power, clothing and footware as well as for personal goods. An average family used to spend double the ratio of their weekly income on personal goods, in 1968 than 2018 with approximately 13.5% and 4.5% respectively. The difference in fuel and power expense, which held around 6% in 1968, was around 1.5% which is not a significant change as others. Likewise, Outlay in clothing and footware halved in 2018 from one-tenth of the weekly income in 1968.
Word Count: 193