Our system will evaluate the answer based on this AI-generated description.
The image depicts a bar graph showing the living issues of city residents in major UK cities in 2008. Newcastle residents report issues with health services (approximately 24%), education and training (approximately 19%), and air pollution (approximately 57%). Belfast residents report issues with health services (approximately 32%), education and training (approximately 30%), and air pollution (approximately 38%). Birmingham residents report issues with health services (approximately 30%), education and training (approximately 40%), and air pollution (approximately 30%). Cardiff has health services (approximately 34%), education and training (approximately 28%), and air pollution (approximately 38%). Manchester reports health services (approximately 45%), education and training (approximately 20%), and air pollution (approximately 35%). Glasgow residents report issues with health services (approximately 50%), education and training (approximately 20%), and air pollution (approximately 30%). London residents report issues with health services (approximately 55%), education and training (approximately 10%), and air pollution (approximately 35%).
Given the complexity of the image, the above description may not be entirely accurate.
Skyrocket your IELTS band score by 1-2 points in under a month with our premium plan!
Note: Both the topic and the answer were created by one of our users.
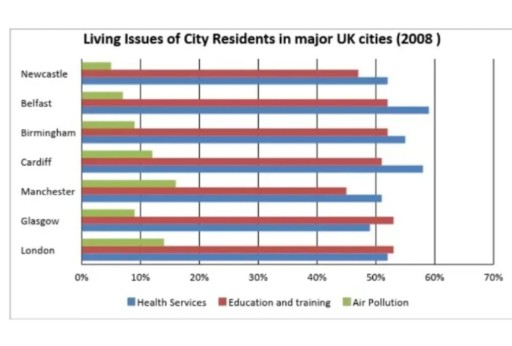
The chart illustrates several important living issues faced by inhabitants of seven major UK cities (Newcastle, Belfast, Birmingham, Cardiff, Manchester, Glasgow, and London) in 2008. Units are given in percentages.
Overall, health services proved to be the most important living issue in most cities, with education and training a close second. Least worrisome of all to UK residents was air pollution that year which on average seems around five times less important to city populations there.
Regarding health services, in five of the seven cities, over 50% of city residents stated it as their number one living issue. This was especially true in Belfast and Cardiff where almost 60% of inhabitants were troubled. Education and training fell a close second for all city populations with a less than 10% difference between the two results, with the exception of Glasgow (53%) and London (52%) where it had become the biggest problem.
With respect to air pollution, only Manchester (16%), London (14%) and Cardiff (12%) had more than ten percent of their inhabitants concerned. Least of all worried about air pollution were those in Newcastle of whom only 5% of people stated this as an issue.
Word Count: 194