Our system will evaluate the answer based on this AI-generated description.
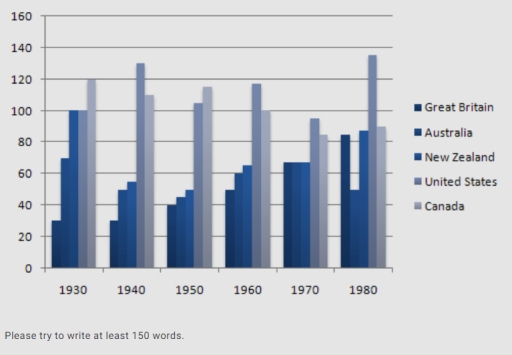
The image shows a bar graph with data from 5 countries—Great Britain, Australia, New Zealand, United States, and Canada—across 6 decades—1930, 1940, 1950, 1960, 1970, 1980. Units on Y-axis range from 0 to 160 with intervals of 20. In 1930, Great Britain and Australia have identical highest values at 120, followed by New Zealand at 100, the United States at 80, and Canada at 60. In 1940, Australia leads at 160, Great Britain at 140, New Zealand at 120, the United States at 100, and Canada at 80. For 1950, Australia's value decreases to 140, Great Britain and New Zealand both at 120, the United States at 100, and Canada at 80. In 1960, New Zealand's data rises to 140, Great Britain at 120, Canada increases to 100, Australia drops to 100, and the United States remains at 100. The 1970 data show New Zealand and Great Britain both at 120, the United States at 100, Australia at 80, and Canada at 60. Finally, in 1980, Australia, United States, and Canada are at 100, Great Britain at 80, and New Zealand drops to 60.
Given the complexity of the image, the above description may not be entirely accurate.
Skyrocket your IELTS band score by 1-2 points in under a month with our premium plan!
Note: Both the topic and the answer were created by one of our users.
The bar chart illustrates the number of prisoners, measured in thousands, in five different countries over a 50-year period. Overall, it is evident that the highest rate of imprisonment (130,000 prisoners) is observed in the United States, while the lowest rate is found in Great Britain.
The data shows that the number of prisoners in Great Britain steadily increased from 25,000 in 1930 to 80,000 in 1980. In contrast, the rates in New Zealand fluctuated significantly. For instance, there were 100,000 prisoners in 1930, followed by a downward trend between 1940 and 1950. However, this figure gradually rose from 1960 to 1980, reaching 70,000 and then 80,000 respectively.
Similarly, Australia experienced both increases and decreases in the number of inmates during the same period. Moreover, the incarceration rates in Canada and the United States varied, with fluctuations observed throughout the timeframe. In the 1980s, the number of prisoners in the United States rose by 40,000 compared to its neighboring countries.
Word Count: 160
