Our system will evaluate the answer based on this AI-generated description.
The image displays a line graph titled "River Water Quality in the UK" tracking data from 1990 to 2002 for Wales, Northern Ireland, England, and Scotland. The y-axis ranges from 0 to 100%, marked at intervals of 10, and represents "Good chemical quality %". Data for each region shows: Wales starting near 95% in 1990, peaking just below 100% around 1994, dipping slightly in 1996, and stabilizing near 95% in 2002. Northern Ireland begins around 60% in 1990, shows a sharp improvement to nearly 90% by 1994, sees a sharp drop back to 60% in 1996, recovers to around 90% by 1998 and 2000, dropping sharply again by 2002. England starts just above 70% in 1990, dips slightly below during the mid-90s, and climbs back to just above 70% by 2002. Scotland begins just under 90% in 1990, experiences a gradual decrease to about 80% by 2002. The graph uses distinct line styles for each region, plotted on a horizontally-oriented rectangular plot area with a grid.
Given the complexity of the image, the above description may not be entirely accurate.
Skyrocket your IELTS band score by 1-2 points in under a month with our premium plan!
Note: Both the topic and the answer were created by one of our users.
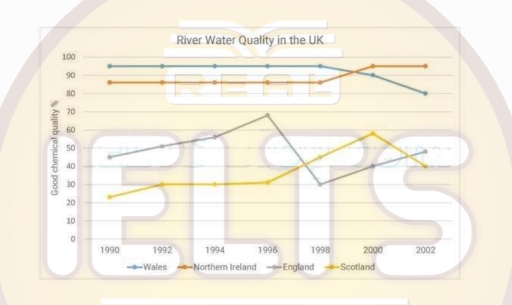
The given line graph illustrates the percentage of river water in four different regions of England that is categorized as possessing excellent chemical quality across the year 1990 and 2002.
Overall, the wales and Northern Ireland contained the higher amount of good chemical quality. However, England and Scotland initially rose but over time they went down. They showed fluctuations.
Getting back to detail in 1990 the wales had 95% and Northern Ireland had 86% of good chemicals. In addition, 1992_1998 both regions displayed sustainability. In 2000, wales declined and reached at 90% but Northern Ireland outraced the wales and it had 93%. Moreover, in 2002 Northern Ireland had sustainability of 93% while wales remained decrease at 80%.
It could be noticed that in 1990 the England had 45% and Scotland had 22% of better chemical types. Furthermore, in 1992 both regions started to surge 51% and 30% vice versa. In 1994 England remained increase at 57% but Scotland had sustainability of 30%. Therefore, in 1996_2000 Scotland rapidly rose at 59%. On the other hand, in 1996 the England had 69% and rapidly decreased to 30% in 1998. Certainly, in 2000 both regions started to rose but in 2002 England had 49% outraced the Scotland which had 40%.
Word Count: 207