Our system will evaluate the answer based on this AI-generated description.
The image is a clustered bar chart with years on the x-axis (1995-2004) and "Minutes in Millions" on the y-axis (2000 intervals from 0 to 18000). Each year has 3 bars representing "Local-landline," "National and international-landline," and "Mobiles." 1995 data: Local-landline around 7200, National and international-landline around 3800, Mobiles around 200. 1996 data: Local-landline around 8000, National and international-landline around 4200, Mobiles around 400. 1997 data: Local-landline around 8600, National and international-landline around 4400, Mobiles around 600. 1998 data: Local-landline around 9200, National and international-landline around 4800, Mobiles around 1000. 1999 data: Local-landline around 9600, National and international-landline around 5000, Mobiles around 1400. 2000 data: Local-landline around 10000, National and international-landline around 5400, Mobiles around 2000. 2001 data: Local-landline around 10400, National and international-landline around 5800, Mobiles around 2600. 2002 data: Local-landline around 10800, National and international-landline around 6200, Mobiles around 3000. 2003 data: Local-landline around 11000, National and international-landline around 6400, Mobiles around 5000. 2004 data: Local-landline around 10000, National and international-landline around 6000, Mobiles around 7000.
Given the complexity of the image, the above description may not be entirely accurate.
Skyrocket your IELTS band score by 1-2 points in under a month with our premium plan!
Note: Both the topic and the answer were created by one of our users.
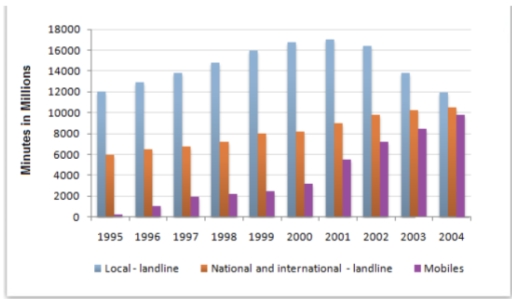
The bar chart illustrates the time spent by Finland residents on three different types of telephone calls between 1995 and 2004.
It is evident from the observation that in 1995, the highest people used local landline at 12000 millions, while this number of minutes rapidly grew in 2001, approximately 17000 millions, before reached it falling sharply at the end of the year with 12000 millions. Moreover, in the starting period ntional and international landline called people spent 6000 minutes , it sharply rose at reached peak approximately 11000 minutes.
Furthermore, at the starting period people spent only 1 minute few times compared to the other telephone calls. However, it was grew slightly in 1999 with 2002 millions, but after it rising from just under 10000 millions.
Overall, it can be seen that the highest finland’s people used local landline calls , whereas, in the ending period they used national and international – landline, and mobile, but compared to the less in local landline.
Word Count: 163
