Our system will evaluate the answer based on this AI-generated description.
The image is a clustered bar chart with years on the x-axis (1995-2004) and "Minutes in Millions" on the y-axis (2000 intervals from 0 to 18000). Each year has 3 bars representing "Local-landline," "National and international-landline," and "Mobiles." 1995 data: Local-landline around 7200, National and international-landline around 3800, Mobiles around 200. 1996 data: Local-landline around 8000, National and international-landline around 4200, Mobiles around 400. 1997 data: Local-landline around 8600, National and international-landline around 4400, Mobiles around 600. 1998 data: Local-landline around 9200, National and international-landline around 4800, Mobiles around 1000. 1999 data: Local-landline around 9600, National and international-landline around 5000, Mobiles around 1400. 2000 data: Local-landline around 10000, National and international-landline around 5400, Mobiles around 2000. 2001 data: Local-landline around 10400, National and international-landline around 5800, Mobiles around 2600. 2002 data: Local-landline around 10800, National and international-landline around 6200, Mobiles around 3000. 2003 data: Local-landline around 11000, National and international-landline around 6400, Mobiles around 5000. 2004 data: Local-landline around 10000, National and international-landline around 6000, Mobiles around 7000.
Given the complexity of the image, the above description may not be entirely accurate.
Skyrocket your IELTS band score by 1-2 points in under a month with our premium plan!
Note: Both the topic and the answer were created by one of our users.
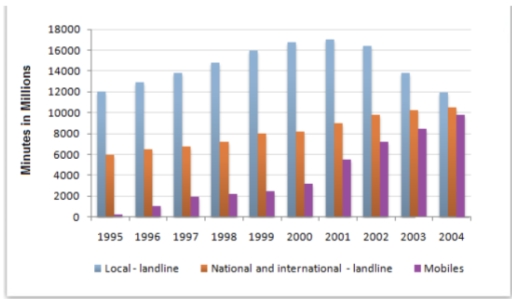
The bar chart illustrates the total number of minutes, measured in millions, spent on telephone calls in the UK, divided into three categories- local landline, national and internatiomal landline, and mobiles-over a nine-year period from 1995 to 2004
Overall, local landline calls accounted for the highest number of minutes throughout the givenperiod, while mobile calls, despite starting from the lowest point, experienced the most dramatic growth. in contrast, national and international landline calls increased steadily, though their rise was less striking than that of mobiles.
in detail, local landline calls began at around 12000 millon minutes in 1995and contiued to rise, peaking at approximately 17000 million minutes in 2001. However, after reaching this peak, their usage gradually decline, falling to roughtly the same level as in 1995 by 2004.
National and international landline calls followed a different pattern. Starting at about 6000 million minutes in 1995, they consistently rose year by year, reaching around 1100 million minutes by 2004. This steadly increase suggests that long-distance communication become more common over the decade.
mobile calls, though initially insignificant at only a few million minutes in 1995 , grew rapidly. The rise accelerated after 1999,(8000) and by 2004,(1100)
Word Count: 196
