🔥 Today Only: Save 30% on Premium — Offer Ends Soon! - Upgrade Now!
Bar Chart

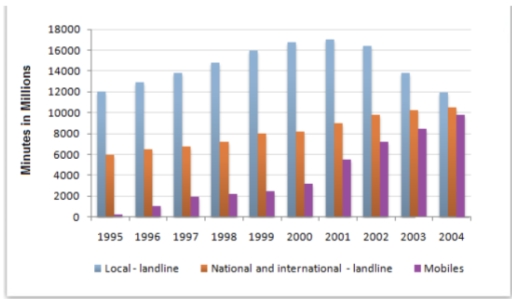
Band 6+: The chart below shows the total number of minutes (in millions) of telephone calls divided into three categories from 1995-2004. Summarise the information by selecting and reporting the main features, and make comparisons where relevant.

Image for topic: The chart below shows the total number of minutes (in millions) of telephone calls divided into three categories from 1995-2004. Summarise the information by selecting and reporting the main features, and make comparisons where relevant.
Our system will evaluate the answer based on this AI-generated description.
The image is a clustered bar chart with years on the x-axis (1995-2004) and "Minutes in Millions" on the y-axis (2000 intervals from 0 to 18000). Each year has 3 bars representing "Local-landline," "National and international-landline," and "Mobiles." 1995 data: Local-landline around 7200, National and international-landline around 3800, Mobiles around 200. 1996 data: Local-landline around 8000, National and international-landline around 4200, Mobiles around 400. 1997 data: Local-landline around 8600, National and international-landline around 4400, Mobiles around 600. 1998 data: Local-landline around 9200, National and international-landline around 4800, Mobiles around 1000. 1999 data: Local-landline around 9600, National and international-landline around 5000, Mobiles around 1400. 2000 data: Local-landline around 10000, National and international-landline around 5400, Mobiles around 2000. 2001 data: Local-landline around 10400, National and international-landline around 5800, Mobiles around 2600. 2002 data: Local-landline around 10800, National and international-landline around 6200, Mobiles around 3000. 2003 data: Local-landline around 11000, National and international-landline around 6400, Mobiles around 5000. 2004 data: Local-landline around 10000, National and international-landline around 6000, Mobiles around 7000.
Given the complexity of the image, the above description may not be entirely accurate.
Note: Both the topic and the answer were created by one of our users.

The bar graph illustrates the number of minutes of telephone calls in the UK of three different categories between 1995 and 2002.

Overall, it can be seen that both national and international landline and mobile experienced a rise over the period, whereas the local landline went through a slight downfall from 2001, but it remained the highest number in the named period.

To begin with, the national and international started with 6000 billion minutes in 1995 and rose to over 1000 billion at the end of the period, only experiencing an increase. In the meantime, mobile call experienced a slower increase, starting with around 0 minutes in 1995, surging to almost 6000 billion in 2001 and skyrocketing to slightly under 10000 in the end of the period (2004).

On the other hand, the local landline remained with the highest number of minutes, amongst the others, throughout the entire 9-year period. At the start, in 1995, the figures were 12000 billion, which was many times greater that that of mobile calls in the same year, and it gradually rose to over 16000 in 2000 and having its peak in 2001 with a little over that amount. The figure for local calls, slowly started dwindling to 12000 billion in 2004. This type of call started and ended with the same number of minutes.

Word Count: 221

Answers On The Same Topic:

The chart below shows the total number of minutes (in millions) of telephone calls divided into three categories from 1995-2004. Summarise the information by selecting and reporting the main features, and make comparisons where relevant.

The bar graph illustrating the three distinct categories shows the total quantitiy of minutes (in billions) of phone calls in the United Kingdom, over an 8 year period starting from 1995 to 2002. In general, local calls remained the most popular category throughout the period, followed by national and international calls, and mobile calls in […]

The chart below shows the total number of minutes (in millions) of telephone calls divided into three categories from 1995-2004. Summarise the information by selecting and reporting the main features, and make comparisons where relevant.

The provided bar graph represents the total quantity of minutes (in billions) of telephone calls in the United Kingdom, separated into three distinct types, between 1995 and 2002. Overall, local phone calls remained as the most popular type of callss during the period. National and international calls rose steadily without breaking the trend. However, mobile […]

The chart below shows the total number of minutes (in millions) of telephone calls divided into three categories from 1995-2004. Summarise the information by selecting and reporting the main features, and make comparisons where relevant.

The bar graph represents the total quantity of minutes (in billions) of telephone calls in the United Kingdom, separated into three different types, between 1995 to 2002. Overall, local calls always remained the most popular type of call among the categories, and was followed by national and international calls. In addition, mobile calls experienced a […]

The chart below shows the total number of minutes (in millions) of telephone calls divided into three categories from 1995-2004. Summarise the information by selecting and reporting the main features, and make comparisons where relevant.

The bar chart illustrates the total number of minutes, measured in millions, spent on telephone calls in the UK, divided into three categories- local landline, national and internatiomal landline, and mobiles-over a nine-year period from 1995 to 2004 Overall, local landline calls accounted for the highest number of minutes throughout the givenperiod, while mobile calls, […]

The chart below shows the total number of minutes (in millions) of telephone calls divided into three categories from 1995-2004. Summarise the information by selecting and reporting the main features, and make comparisons where relevant.

The bar chart illustrates the time spent by Finland residents on three different types of telephone calls between 1995 and 2004. It is evident from the observation that in 1995, the highest people used local landline at 12000 millions, while this number of minutes rapidly grew in 2001, approximately 17000 millions, before reached it falling […]

See All

Other Topics:

The chart below shows the annual number of rentals and sales (in various formats) of films from a particular store between 2002 and 2011. Summarize the information by selecting and reporting the main features, and make comparison

The bar chart compares the yearly figures of rentals and sales in 4 different formats (Rentals, VHS, DVD, Blu-ray) of film from a specific store from 2002 to 2011. Overall, DVD sales recorded the higestest figures from 2004 till 2011. on the other hand Blue-ray sales represented least sales throughout the period. while rentals showed […]

The chart below shows the annual number of rentals and sales (in various formats) of films from a particular store between 2002 and 2011. Summarize the information by selecting and reporting the main features, and make comparison

The bar chart compares the yearly figure of rentals and sales in 4 different formats (Rentals, VHS, DVD, Blu ray) of film from a specific store from 2002 to 2011. Overall, DVD sales recorded the higestest figures from 2004 till 2011. on the other hand Blue-ray sales represented least sales throughout the period. while rentals […]

The chart below shows the number of artisans worldwide between 1950, 2000, and 2050. Summarise the information by selecting and reporting the main features and make comparisons where relevant.

The bar chart compares the number of artisans, measured in millions, working in seven different artistic fields in 1950 and 2000, with projections for 2050. Overall, painting and poetry had the highest numbers of artisans in 1950, whereas film making and performing arts are expected to become the most popular fields by 2050. While most […]

The chart illustrates data about world population proportion and location division of wealth by region.

The chart illustrastes information about worldwide population proportion and disturbution of weath by region. Overall, regarding wealth, north America recorded for highest figure, whereas India and Africa had the smallest proportion. Meanwhile, China had the highest population, while rich Asia-Pacific recorded the smallest population. In terms of wealth, North America is accounted for about 34%, […]

The bar chart below shows the average duration of housework done by women and men done.

The bar chart shows the comparative data on the average number of hours spent in housework by four groups of people. Overall, it is clear that women without employment spent the longest time on their household chores than women with employment, but they still worked more than their male counterparts. After a detailed analysis, it […]

The chart below shows the number of car trips taken by men and women for different purposes per day in a European city.

The bar chart shows how many car trips were taken by men and women for different purposes on daily basis in a European city. Overall, females took more trips for eating out, meeting friends and shopping, compared to their counterparts, who recorded higher figures in entertainment, taking children to school, and commuting. In addition, regardless […]

See All
We have detected unusual activity on your device.
Please verify your identity to continue.
Note: This verification step won't sign you in. If you have a premium account, please log in to access the service as usual.
Google/Gmail Verification
Or verify using Email/Code
We've sent a verification code to:
youremail@gmail.com (Not your email?)
Enter it below to complete the verification process.
Ensure your email address is correct, your inbox is not full, and you check your spam folder. If no email arrives, consider using an alternative email.
You will need a Premium plan to perform your action!
Note: If you already have a premium account, please log in to access our services as usual.

Plans & Pricing

Our mission is to make quality education accessible for everyone.
However, to keep our hardworking team running and this service alive, we genuinely need your support!
By opting for a premium plan, not only do you sustain us in achieving the mission, but you also unlock advanced features to enrich your learning experience.

Free

For learners who aren't pressed for time

What's included on Free
100+ Cambridge IELTS Tests
Instant IELTS Writing Task 1 & 2 Evaluation (2 times/month)
Instant IELTS Speaking Part 1, 2, & 3 Evaluation (2 times/month)
Instant IELTS Writing Task 1 & 2 Essay Generator (2 times/month)
500+ Dictation & Shadowing Exercises
100+ Pronunciation Exercises
Flashcards
Other Advanced Tools

Premium

For those serious about advancing their English proficiency, and for IELTS candidates aspiring to boost their band score by 1-2 points (especially in writing & speaking) in just 30 days or less

What's included on Premium
Save Your IELTS Test Progress & Analyze Mistakes By Question Type
Save Your Own Flashcard Sets & Use Them On Any Device
Unlock All Courses, IELTS Tests, Section & Part Practice
Unlimited AI Conversations
Unlimited AI Writing Enhancement Exercises
Unlimited IELTS Writing Task 1 & 2 Evaluation
Unlimited IELTS Speaking Part 1, 2, & 3 Evaluation
Checked Answers Will Not Be Published
Unlimited IELTS Writing Task 1 & 2 Essay Generator
Unlimited IELTS Speaking Part 1, 2, & 3 Sample Generator
Unlimited Usage Of Advanced Tools & AI Features
Priority Support within 24h (12-month plan only)

Due to the nature of our service and the provided free trials, payments are non-refundable.