Our system will evaluate the answer based on this AI-generated description.
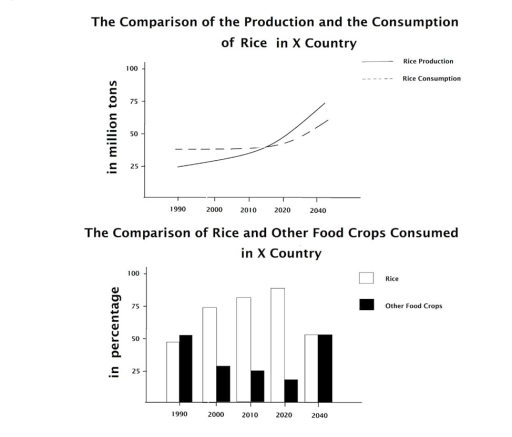
The image presents two graphs related to rice in X Country, with timelines from 1990 to 2040. The top graph, marking "Rice Production" in solid lines and "Rice Consumption" in dashed lines, displays a quantitative increase in million tons: production rises from roughly 25 in 1990, stays near 50 in 2010 and 2020, anticipated to escalate near 75 by 2040; consumption initiates around 20 in 1990, approximates 40 by 2010 and 2020, predicting a rise to about 60 by 2040. The bottom graph contrasts the percentages of "Rice" versus "Other Food Crops" consumed over the same periods: in 1990, Rice accounts for nearly 45%, other crops at 55%, in 2000, rice slightly drops below 40%, other crops surpassing 60%, by 2010 rice ascends back to 45%, maintaining a balance near 55% for other crops, displaying a notable increase in rice at about 55% with other crops lessening around 45% for 2020, with a speculated continuous trend leading to 2040 showing rice possibly near 60% and other crops at 40%.
Given the complexity of the image, the above description may not be entirely accurate.
Skyrocket your IELTS band score by 1-2 points in under a month with our premium plan!
Note: Both the topic and the answer were created by one of our users.
The mixed graph compares the comparison of the production and the consumption quantity of Rice and the analogy of rice and Other food crops consumed percentage in X country between 1990 and 2040. Overall,it is interesting to note that rice manufacturing and expenditure over a period of 50 years. It is interesting to note that both rice and other food crops fluctuated between 1990 and 2040.
Looking at line graph in more detail, the production of rice consumption stood at approximately at 50 million tons, which is more higher two times than production,roughly at 25 mil. tons. The fabrication of rice experience a moderate increase, which increase from 25 to nearly 55,respectively in 1990 and 2040. While it can be seen that the expenditure of rice show the same trend, surge in a normal upward trend to roughly 70 million tons 2040.
It can be observed by the facts that, the rice is accounted for roughly 52%, which is compared nearly to 47% for other foods.
It peaked considerably from 47% in 1990 to 77% percent in 2020 before fell sharply by 25 percent in 2040. On other hand, the proportion of other foods decrease gently from 47% to 25 % between 1990 and 2020,which is followed by a abrupt growing to 50 %.
Word Count: 214
