Our system will evaluate the answer based on this AI-generated description.
The image illustrates demographic trends in Scotland from 1940 to 2050, showing three key rates: birth, population growth, and death. In 1940, birth rate stands at 2.5%, population growth rate at 0.7%, and death rate at 1.5%. By 1950, birth rate remains around 2.6%, population growth reaches 1.0%, death rate is about 1.4%. From 1960 to 1970, birth rate peaks at 2.9% in 1960 and drops to 2.1% by 1970; population growth rate peaks at 1.1% in 1960, reduces to 1.0% by 1970; death rate remains steady around 1.3%. A continued decline in birth rate and population growth rate is observed from 1980, with birth rate at 1.7% in 1980, 1.2% in 1990, and further dropping to 1.0% by 2000; population growth rate remains at 0.7% in 1980, decreases to 0.4% in 1990, and to 0.0% in 2000. Death rate remains near 1.2% in 1980 and decreases to 1.1% by 2000. From 2010 to 2050, the birth rate declines from 1.2% in 2010 to 0.8% forecasted in 2050; the population growth rate reduces from 0.2% in 2010 to negative values around -0.1% by 2050; the death rate drops from 1.3% in 2010 to about 0.4% by 2050.
Given the complexity of the image, the above description may not be entirely accurate.
Skyrocket your IELTS band score by 1-2 points in under a month with our premium plan!
Note: Both the topic and the answer were created by one of our users.
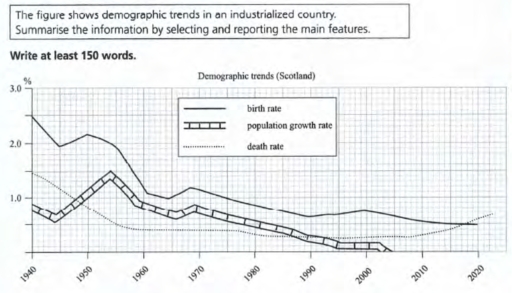
The present line graph depicts the changes of three core variables in demographic data of an industrialized country in a time span of 60 years. At first glance, it is evident that a general decreasing trend was dominated on all studied categories from 1940 to 2020.
A closer examination of figures reveals that the fluctuations of birth rate with population growth is directly proportional. This pattern is particularly evident during 1940 to 1970, where all picks and troughs are completely correlated. Interestingly, as the population expansion was reached to zero percentage form 2005 onwards, birth rate levelled off at the same period.
On the other hand, there appears to be an inverse correlation between death rate and population growth which is truly apparent during 1940 to 1960. In other words, commencing from 1.5 percent, death rate dropped sharply below 0.5 percent. At the same period, population rate reached 1.5 percent after it started from slightly below 1 percent.
Overall, the provided figures by each line graph highlighted a correlated pattern among three key variables in a demographic dataset, suggesting how they fluctuate in a 60-year time frame.
Word Count: 187