Our system will evaluate the answer based on this AI-generated description.
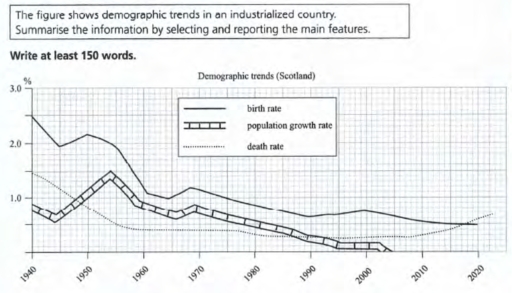
The image illustrates demographic trends in Scotland from 1940 to 2050, showing three key rates: birth, population growth, and death. In 1940, birth rate stands at 2.5%, population growth rate at 0.7%, and death rate at 1.5%. By 1950, birth rate remains around 2.6%, population growth reaches 1.0%, death rate is about 1.4%. From 1960 to 1970, birth rate peaks at 2.9% in 1960 and drops to 2.1% by 1970; population growth rate peaks at 1.1% in 1960, reduces to 1.0% by 1970; death rate remains steady around 1.3%. A continued decline in birth rate and population growth rate is observed from 1980, with birth rate at 1.7% in 1980, 1.2% in 1990, and further dropping to 1.0% by 2000; population growth rate remains at 0.7% in 1980, decreases to 0.4% in 1990, and to 0.0% in 2000. Death rate remains near 1.2% in 1980 and decreases to 1.1% by 2000. From 2010 to 2050, the birth rate declines from 1.2% in 2010 to 0.8% forecasted in 2050; the population growth rate reduces from 0.2% in 2010 to negative values around -0.1% by 2050; the death rate drops from 1.3% in 2010 to about 0.4% by 2050.
Given the complexity of the image, the above description may not be entirely accurate.
Skyrocket your IELTS band score by 1-2 points in under a month with our premium plan!
Note: Both the topic and the answer were created by one of our users.
The figure shows the amount of industrialized country. Summarize the displays by selecting and reporting the main features.
The figure shows displays in Schotland country that demographic trends between 1940 and 2020. There are birth rate, population growth rate, death rate. For intance birth rate to be every year change it percentage. At the beginning it that fall then go up. However become fluctuate. Population growth rate this types start up 1.5 percentage. The type in 1940 year decreased next year also decreased. Then the table be constant change. The last demographic trend it is death rate. This type very sad because your first year it is suddenly grow but next to next years to be arounded. but this statics finished in 2000 year.
Overall, the demographic trends in Scotland this analys gives information for 1940 to 2020 years. Maybe the table changed for the future in a good state.
Word Count: 150