Our system will evaluate the answer based on this AI-generated description.
The image illustrates demographic trends in Scotland from 1940 to 2050, showing three key rates: birth, population growth, and death. In 1940, birth rate stands at 2.5%, population growth rate at 0.7%, and death rate at 1.5%. By 1950, birth rate remains around 2.6%, population growth reaches 1.0%, death rate is about 1.4%. From 1960 to 1970, birth rate peaks at 2.9% in 1960 and drops to 2.1% by 1970; population growth rate peaks at 1.1% in 1960, reduces to 1.0% by 1970; death rate remains steady around 1.3%. A continued decline in birth rate and population growth rate is observed from 1980, with birth rate at 1.7% in 1980, 1.2% in 1990, and further dropping to 1.0% by 2000; population growth rate remains at 0.7% in 1980, decreases to 0.4% in 1990, and to 0.0% in 2000. Death rate remains near 1.2% in 1980 and decreases to 1.1% by 2000. From 2010 to 2050, the birth rate declines from 1.2% in 2010 to 0.8% forecasted in 2050; the population growth rate reduces from 0.2% in 2010 to negative values around -0.1% by 2050; the death rate drops from 1.3% in 2010 to about 0.4% by 2050.
Given the complexity of the image, the above description may not be entirely accurate.
Skyrocket your IELTS band score by 1-2 points in under a month with our premium plan!
Note: Both the topic and the answer were created by one of our users.
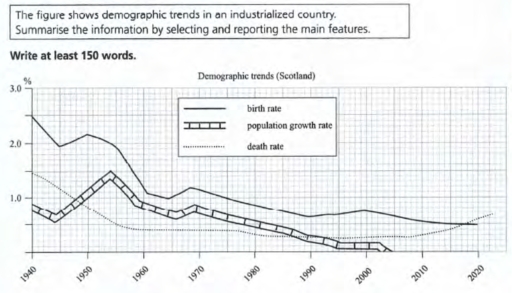
The graphic above illustrates trend of demographic in Scotland between 1940 to 2020 in percent. The trend has three factors which are birth rate, population growth rate and death rate.
From overall percpective , the population growth rate and birth rate slowly dropped over the following years. On the other hand, the death rate of Scotland decreased slowly at the first half of the timeline and then increased in second half of the timeline. In 1940 the highest rate was birth rate with 2.5 percent and then death rate with 1.5 percent . At last population growth rate was around 0.8 percent in 1940.
In details , the death rate was constanly dropping to 0.2 percent from 1.5 percent during 1940 to 2000. Then gradually increasing over last 20 years to 0.6 percent.
On the other side , the birth rate and population growth rate wavered in given timeline. However this two trend flopped steadily over the years. Birth rate was 2.5 percent in 1940 but dropped to 0.5 pecrent in 2020. The population growth rate increased significantly in 1954 becoming 1.5 percent from 0.8 percent. However this trend decreased over last years and becoming 0 percent in early 2000.
Word Count: 200