Our system will evaluate the answer based on this AI-generated description.
The image presents a line graph depicting stock price movements for Facebook, Google, Apple, and Yahoo from 2011 to 2016. In 2011, the stock prices start with Facebook approximately at 0, Google around 5,000, Apple close to 5,000, and Yahoo near 15,000. By 2012, Facebook's price rises slightly over 10,000, Google ascends to near 10,000, Apple climbs significantly above 15,000, and Yahoo remains around 15,000. In 2013, Facebook's price increases above 10,000, Google jumps to nearly 15,000, Apple fluctuates around 15,000, and Yahoo falls below 10,000. In 2014, Facebook climbs over 10,000, Google reaches about 20,000, Apple approaches 30,000, and Yahoo drops slightly under 10,000. By 2015, Facebook surges to close to 25,000, Google maintains around 20,000, Apple exceeds 30,000, and Yahoo stabilizes under 5,000. In 2016, stock prices show Facebook around 10,000, Google close to 25,000, Apple approximately at 35,000, while Yahoo drops further below 5,000.
Given the complexity of the image, the above description may not be entirely accurate.
Skyrocket your IELTS band score by 1-2 points in under a month with our premium plan!
Note: Both the topic and the answer were created by one of our users.
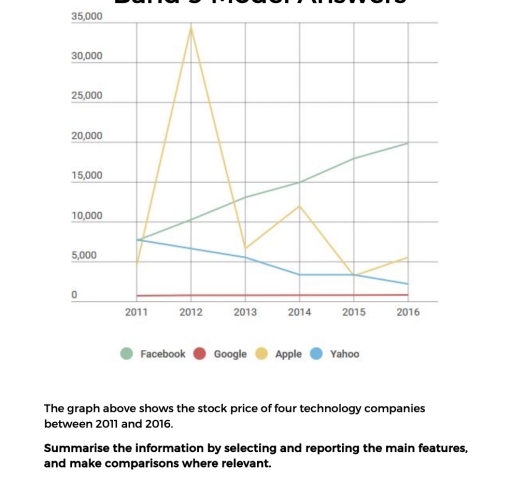
The chart gives information about stock cost of companies like Facebook, Google, Apple and Yahoo from 2011 and 2016.
Overall, the stock price of Apple and Facebook witnessed an upward trend. The figure for Yahoo decreased througout the period, while Google’s stock price remained relatively stable.
To begin, Apple priced 5,000 in 2011, after 1 year apple’s stock cost increased sevenfold and had the most expensive stock price; However in 2013 Apple witnessed massive decrease and Facebook overtook it. Facebook increased consistently from 2011 to 2016 and ended up with a price around 20,000, while apple costed just over 5000.
Turning to Yahoo it costed approximately 8,000 in 2011 and decresed steadily to around 4,000 in 2014. It remained relatively unchanged from 2014 t0 2015 and reached a low of around 3,000 at the end of the period. Google remained stable all 5 years and had the cheapiest stock price.
Word Count: 150