Our system will evaluate the answer based on this AI-generated description.
The image contains a line graph comparing visits to 'Music Choice' and 'Pop Parade' over 15 days; day 1, 'Music Choice' had 40 visits and 'Pop Parade' had 120 visits; day 2, 'Music Choice' rose to 100 visits, 'Pop Parade' dropped to 80 visits; day 3, 'Music Choice' dropped to 20 visits, 'Pop Parade' rose to 140 visits; day 4, 'Music Choice' rose to 120 visits, 'Pop Parade' dropped to 100 visits; day 5, 'Music Choice' dropped to 60 visits, 'Pop Parade' rose to 160 visits; day 6, 'Music Choice' rose to 140 visits, 'Pop Parade' dropped to 120 visits; day 7, 'Music Choice' dropped to 20 visits, 'Pop Parade' rose to 180 visits; day 8, 'Music Choice' rose to 100 visits, 'Pop Parade' dropped to 20 visits; day 9, 'Music Choice' dropped to 60 visits, 'Pop Parade' rose to 160 visits; day 10, 'Music Choice' rose to 160 visits, 'Pop Parade' dropped to 60 visits; day 11, 'Music Choice' dropped to 20 visits, 'Pop Parade' rose to 180 visits; day 12, 'Music Choice' rose to 100 visits, 'Pop Parade' dropped to 60 visits; day 13, 'Music Choice' dropped to 60 visits, 'Pop Parade' rose to 140 visits; day 14, 'Music Choice' rose to 140 visits, 'Pop Parade' dropped to 100 visits; day 15, 'Music Choice' dropped to 40 visits, 'Pop Parade' rose to 160 visits; y-axis scale is in increments of 20 from 0 to 180, labeled '000s'; x-axis labeled 'Days' from 1 to 15; 'Music Choice' represented by dashed line, 'Pop Parade' represented by dotted line.
Given the complexity of the image, the above description may not be entirely accurate.
Skyrocket your IELTS band score by 1-2 points in under a month with our premium plan!
Note: Both the topic and the answer were created by one of our users.
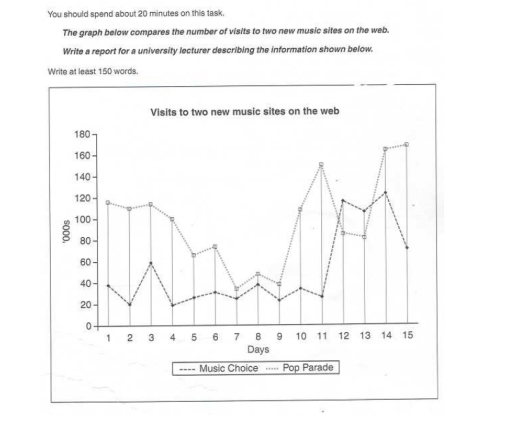
The line graph shows data about how many people visited both new sites on the internet between 1st and 15th day.
It is clear that the total number of visits to two sites rose gradually between the first and the fifteenth day. Overall, pop parade music had the highest number of website visits, while music choice registered a gradual rise from the 1st to the 15th day.
Music Choice experienced gradual fluctuation between the 4th and the 11th day, after that there was a dramatic increase in the number of visits on the 12th day. On day 14, the number of hits reached a peak and stood at 120.000
The number of visits of Pop Parade started at approximately 120.000, however it decreased rapidly by the 7th day. On the 11th day, the number of visits rose enormously to approximately 145.000. There was a moderate dip between the 12th and the 14th day in the number of visits. After that, it stabilized at 170.000.
Word Count: 164
