Our system will evaluate the answer based on this AI-generated description.
The image is a line graph titled "Oil use of major consumers" with the x-axis representing years (2009, 2015, 2025, 2030) and the y-axis representing millions of barrels per day, ranging from 0 to 10 in increments of 2. Four lines depict the oil use of different consumers: US (dotted line), China (solid line with triangles), Western Europe and Japan (solid line), Middle East (dashed line with circles). In 2009, US used around 9 million barrels per day, Western Europe and Japan about 5, China approximately 3.5, and Middle East nearly 2. By 2015, US declined to around 8, Western Europe and Japan to 4, Middle East increased to 3, and China rose to about 6. The projected use in 2025 shows US at 6, Western Europe and Japan at 3, China at 8, and Middle East at 4. By 2030, US is expected to decrease to 5.5, Western Europe and Japan to 2.5, China to maintain at 8, and Middle East to increase to 5.
Given the complexity of the image, the above description may not be entirely accurate.
Skyrocket your IELTS band score by 1-2 points in under a month with our premium plan!
Note: Both the topic and the answer were created by one of our users.
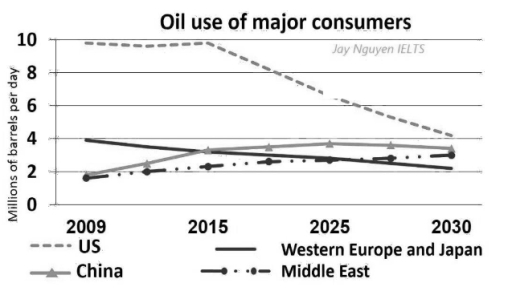
The graph provides information about the use of oil by major consumers from 2009 to 2015, and makes projection for 2025-2030. Units are measured in millions of barrels per day.
Overall, the US consumed more oil than others all the given time, and estimated to make so. While the oil use rates of China and Middle East increased over the period given, the opposite is true for the US and Western Europe and Japan.
Moving to detailed analysis, in 2009 the both figures for China and Middle East stood at approximately 1.8. They grew and reached 3.2 and 2.2 respectively in 2015. Oil use of these two consumers is forecast to rise marginally to 3.8 (China) and 2.8 (Middle East) in 2025. Although the former is set to fall slowly, the latter will have an upward trend, and both are anticipated to use 3 million of barrels of oil per day in 2030.
On the other hand, the rates of the US and Western Europe and Japan were 9.9 and 4 respectively at the beginning. While the former remained unchanged, the latter declined gradually and was overtaken by China in 2015. It is projected that the figure for the US will decrease dramatically to 4.1, while that for Western Europe and Japan will fall steadily to 2.1 in 2030.
Word Count: 219