🔥 Today Only: Save 30% on Premium — Offer Ends Soon! - Upgrade Now!
Bar Chart

Band 6+: The graph below provides information about iPhone sales data in 2023 and early 2024. Summarise the information by selecting and reporting the main features, and make comparisons where relevant. You should write about 150 words.

Image for topic: The graph below provides information about iPhone sales data in 2023 and early 2024. Summarise the information by selecting and reporting the main features, and make comparisons where relevant. You should write about 150 words.
Our system will evaluate the answer based on this AI-generated description.
The image displays a series of vertical bar segments labeled from "June & Earlier" to "Feb." The proportion breakdown displays percentages for iPhone models across these time frames. For "June & Earlier": iPhone 14 Plus ~0%, iPhone 14 ~40%, iPhone 14 Pro ~10%, iPhone 14 Pro Max ~50%. For "July": iPhone 14 Plus ~0%, iPhone 14 ~10%, iPhone 14 Pro ~20%, iPhone 14 Pro Max ~70%. For "Aug.": iPhone 14 Plus ~0%, iPhone 14 ~10%, iPhone 14 Pro ~20%, iPhone 14 Pro Max ~70%. For "Sept.": iPhone 14 Plus ~0%, iPhone 14 ~20%, iPhone 14 Pro ~50%, iPhone 14 Pro Max ~30%. For "Oct.": iPhone 14 Plus ~10%, iPhone 14 ~20%, iPhone 14 Pro ~40%, iPhone 14 Pro Max ~30%. For "Nov.": iPhone 14 Plus ~10%, iPhone 14 ~20%, iPhone 14 Pro ~40%, iPhone 14 Pro Max ~30%. For "Dec.": iPhone 14 Plus ~5%, iPhone 14 ~30%, iPhone 14 Pro ~35%, iPhone 14 Pro Max ~30%. For "Jan.": iPhone 14 Plus ~0%, iPhone 14 ~20%, iPhone 14 Pro ~40%, iPhone 14 Pro Max ~40%. For "Feb.": iPhone 14 Plus ~5%, iPhone 14 ~15%, iPhone 14 Pro ~40%, iPhone 14 Pro Max ~40%. The line representing "Pro/Pro Max Share" demonstrates incremental values across months, starting below ~30% in June & Earlier and ending near ~80% in Feb.
Given the complexity of the image, the above description may not be entirely accurate.
Note: Both the topic and the answer were created by one of our users.

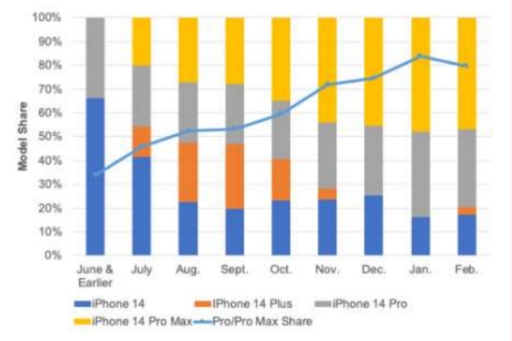
The graph shows iPhone sales data in 2023 and early 2024. Generally, the share of iPhone 14 Pro and Pro Max increases over the months.

On June and earlier, there was only two models sold: iPhone 14 and iPhone 14 Pro. In the next period, the share was spread into four models, with iPhone 14 dominated the proportion, with approximately 40% share, followed by iPhone 14 Pro, iPhone 14 Pro Max, and iPhone 14 Plus. In August and September, no single model dominated the sales. All models was spread equally in terms of sales portion.

Started in October 2023, iPhone 14 Plus share shrinked and disappeared in December and January 2024, before it was appeared again with a very small portion in February 2024. Conversely, the shares of iPhone 14 Pro and Pro Max rose until it was dominated the sales proportion gradually. The rose of iPhone 14 Pro and Pro Max’s share reflected by the line that shows it’s trend above the stacked bar chart.

Overall there was a shift in consumer behavior following time after iPhone 14 series released.

Word Count: 181

Answers On The Same Topic:

The graph below provides information about iPhone sales data in 2023 and early 2024. Summarise the information by selecting and reporting the main features, and make comparisons where relevant. You should write about 150 words.

The chart below illustrates the model share of several different iPhone including: iPhone 14, iPhone 14 Plus, iPhone 14 Pro and iPhone 14 Pro Max from June 2023 to February 2024. Overall, the model share of iPhone 14 and iPhone 14 plus showed strong fluctuation and noticeable decline through the period, in contrast with a […]

The graph below provides information about iPhone sales data in 2023 and early 2024. Summarise the information by selecting and reporting the main features, and make comparisons where relevant. You should write about 150 words.

The bar chart illustrates the model share of various iPhone versions from June 2023 to February 2024, including the iPhone 14, 14 Plus, 14 Pro, and 14 Pro Max. Overall, the data shows a significant shift in consumer preference from standard models to premium ones, with the iPhone 14 Pro Max gradually dominating the market […]

The graph below provides information about iPhone sales data in 2023 and early 2024. Summarise the information by selecting and reporting the main features, and make comparisons where relevant. You should write about 150 words.

The given graph details four iPhone 14 models’ share of revenue gained in 2023 and early 2024. Overall, it is noticeable that iPhone 14 and 14 Plus share shrank over time due to two remaining counterparts’ preponderance. Additionally, although the iPhone 14 constituted the most from the beginning, it was soon surpassed by the Pro […]

See All

Other Topics:

3. The bar chart below shows the percentage of boys and girls participating in various activities in 2010 in Vietnam.

The given bar chart depicts the percentage of Vietnamese’ children of both gender male and female in six various entertainment activities in 2010. Overall, boys were most generally attracted to physical activities, whereas girls likely preferred the indoor entertainments. In addition, females had generated the higher participation across most given sources of entertainment, except for […]

The chart below gives information about science qualifications held by people in two countries. Summarise the information by selecting and reporting the main features, and make comparisons where relevant.

The bart chart compares the proportion of people in Malaysia and Singapore who hold different science qualifications, including no qualification, school leaving exams, bachelor’s degree and master’s degree. Overall, the largest proportion of people in both countries have no science qualification, while the smallest proportion of people is with master’s degree. Singapore has a higher […]

The bar chart shows the number and the purpose of trips by made by men and women in a certain European country in 2007.

The bar chart gives information about the number and the purpose of trips made by men and women in one European country in 2007. Overall, men dominated in most categories, except for visiting friends and shopping. Travelling to work was common among men, whereas shopping attracted the highest number of women. Of particular note is […]

The chart below shows the number of male and female students studying six art related subjects at a UK university in 2011.

Information about students who pursuing six art related subjects in the UK in 2011 are provided in the chart above.Overall, English languange and literature was the highest subject-choosen by the students during the given period. Female students, by all trends, indicate the highest enrolment. However, two subjects such as Philosphy and History, contribute to the […]

The bar chart shows the rate of participation in top ten most popular sports in Canada in 1998 and 2005

The bar chart compares the percentage of people who participated in different sports in 1998 and 2005. Overall, golf was the most popular sport in both years, whereas tennis was the least played. In 1998, physical activities were more common. There was a noticeable contrast between the proportions of baseball players, with older participants being […]

The bar chart shows the rate of participation in top ten most popular sports in Canada in 1998 and 2005

The bar chart compares the percentage of people who participated in different sports in 1998 and 2005. Overall, golf was the most popular game in both years, whereas tennis was the least played. In 1998, physical activities were more common, respectively. There was a noticeable contrast between the proportions of baseballers, with olds being significantly […]

See All
We have detected unusual activity on your device.
Please verify your identity to continue.
Note: This verification step won't sign you in. If you have a premium account, please log in to access the service as usual.
Google/Gmail Verification
Or verify using Email/Code
We've sent a verification code to:
youremail@gmail.com (Not your email?)
Enter it below to complete the verification process.
Ensure your email address is correct, your inbox is not full, and you check your spam folder. If no email arrives, consider using an alternative email.
You will need a Premium plan to perform your action!
Note: If you already have a premium account, please log in to access our services as usual.

Plans & Pricing

Our mission is to make quality education accessible for everyone.
However, to keep our hardworking team running and this service alive, we genuinely need your support!
By opting for a premium plan, not only do you sustain us in achieving the mission, but you also unlock advanced features to enrich your learning experience.

Free

For learners who aren't pressed for time

What's included on Free
100+ Cambridge IELTS Tests
Instant IELTS Writing Task 1 & 2 Evaluation (2 times/month)
Instant IELTS Speaking Part 1, 2, & 3 Evaluation (5 times/month)
Instant IELTS Writing Task 1 & 2 Essay Generator (2 times/month)
500+ Dictation & Shadowing Exercises
100+ Pronunciation Exercises
Flashcards
Other Advanced Tools

Premium

For those serious about advancing their English proficiency, and for IELTS candidates aspiring to boost their band score by 1-2 points (especially in writing & speaking) in just 30 days or less

What's included on Premium
Save Your IELTS Test Progress
Unlock All Courses & IELTS Tests
Unlimited AI Conversations
Unlimited AI Writing Enhancement Exercises
Unlimited IELTS Writing Task 1 & 2 Evaluation
Unlimited IELTS Speaking Part 1, 2, & 3 Evaluation
Checked Answers Will Not Be Published
Unlimited IELTS Writing Task 1 & 2 Essay Generator
Unlimited IELTS Speaking Part 1, 2, & 3 Sample Generator
Unlimited Usage Of Advanced Tools
Priority Support within 24h (12-month plan only)

Due to the nature of our service and the provided free trials, payments are non-refundable.
Nếu bạn là người Việt Nam và không có hoặc không muốn trả bằng credit/debit cards, bạn có thể thanh toán bằng phương thức chuyển khoản:


Chọn gói:
419,000₫ 277,000 ₫ cho gói 1 tháng (chỉ 9,233₫/ngày)
1,239,000₫ 597,000 ₫ cho gói 3 tháng (chỉ 6,633₫/ngày)
2,469,000₫ 1,027,000 ₫ cho gói 6 tháng (chỉ 5,706₫/ngày)
4,929,000₫ 1,417,000 ₫ cho gói 12 tháng (chỉ 3,936₫/ngày)


Sau khi chuyển khoản, vui lòng đợi trình duyệt tự động điều hướng bạn trở lại Engnovate và bạn sẽ ngay lập tức nhận được mã kích hoạt tài khoản premium.
Nếu có lỗi xảy ra, bạn có thể liên hệ với team thông qua một trong các phương thức: email đến helloengnovate@gmail.com hoặc nhắn tin qua facebook.com/engnovate.
Vì toàn bộ công cụ trên website đều có thể sử dụng thử miễn phí, Engnovate không hỗ trợ hoàn tiền.