🔥 Today Only: Save 30% on Premium — Offer Ends Soon! - Upgrade Now!
Line Graph

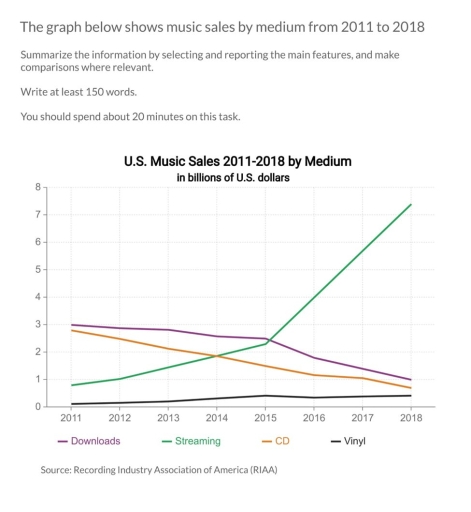
Band 5+: The graph below shows music sales by medium from 2011 to 2018.

Image for topic: The graph below shows music sales by medium from 2011 to 2018.
Our system will evaluate the answer based on this AI-generated description.
The image depicts U.S. music sales in billions of U.S. dollars from 2011-2018 for downloads, streaming, CD, and vinyl. In 2011, downloads were at 3.1, streaming at 0.6, CD at 3.6, and vinyl at 0.2. By 2012, downloads reached 3.5, streaming at 1.0, CD at 3.1, and vinyl remained at 0.2. In 2013, downloads decreased slightly to 3.4, streaming rose to 1.4, CD dropped to 2.7, and vinyl increased to 0.3. In 2014, downloads decreased to 3.0, streaming increased to 2.0, CD continued to drop to 2.2, and vinyl reached 0.4. In 2015, downloads fell to 2.3, streaming rose to 2.5, CD dropped to 2.0, and vinyl increased to 0.5. For 2016, downloads decreased to 1.8, streaming surpassed other mediums reaching 3.5, CD continued declining at 1.5, and vinyl climbed to 0.6. In 2017, downloads further decreased to 1.3, streaming at 4.3, CD at 1.1, and vinyl to 0.7. By 2018, downloads were at 0.9, streaming soared to 7.0, CD at 0.6, and vinyl at 0.8.
Given the complexity of the image, the above description may not be entirely accurate.
Note: Both the topic and the answer were created by one of our users.

The line graph shows the disparities in music sales from four various mediums, over a seven year period starting from 2011.

Overall it is clear that music sales from streaming saw the biggest change, with a general upward trend;while sales from downloads and CD are sales decline, vinyl ‘s figures followed an opposite trajectory.

Looking first at the sale value of straming ,this medium recorded the most sustancial change.With an initial standing of just under 1 bln U.S dollars in 2011, the figures had skyrocketed to just over $2 bln by 2015 and then rose further to reach a peak at roughly $7.2 bln in the final year.Moreover, the figure for venyl records started off with just under $0.2bln and finished timeframe with just under $0.3bln, after a gradual rise.

As for the remaining mediums,Downloads and CD , the changes were not as dramatic.The former medium started the period as the leading sailor of muscis at around $3bln, experienced a fall to roughly $1bln in 2018.The latter listened musics worth just under $3bln in 2011, after which this figure trended downward to approximately $1bln in final year.

Word Count: 187

Answers On The Same Topic:

The graph below shows music sales by medium from 2011 to 2018.

The line graph illustrates track sales by medium between 2010 and 2018. Overall, initially streaming medium is become the lowest pattern, but then this was followed by increased sharply. The figure for the number of the vinyl medium sales witnessed remain unchanged. The download and cd mediums were become the highest sales figure, however, this […]

The graph below shows music sales by medium from 2011 to 2018.

The line graph illustrates the disparities in music sales across various formats. Overall, music sales through streaming exhibited the most significant change, demonstrating a general upward trend until the end of the period, while downloads and CD sales followed an opposite trajectory. Focusing first on streaming sales, this format experienced the most substantial growth. Starting […]

The graph below shows music sales by medium from 2011 to 2018.

The graph illustrates the trends in music sales across various mediums in the United States from 2011 to 2018. Overall, while the majority of music sales mediums experienced a decline, streaming demonstrated significant growth throughout the period. Initially, download sales began at 3.1 billion dollars in 2011, with a slight increase to 3.5 billion in […]

The graph below shows music sales by medium from 2011 to 2018.

The line graph illustrates the sales of music in the United States across four different mediums: downloads, streaming, CDs, and vinyl measured in billions of dollars. Overall, it is clear that streaming experienced a dramatic increase, becoming the dominant format by the end of the period, while both downloads and CD sales declined sharply. Vinyl […]

The graph below shows music sales by medium from 2011 to 2018.

The line graph presents changes in the amount of music sales via four different sources – measured in billions of dollars – by medium between 2011 and 2018. Overall, there was an upward trend for streaming and vinyl, with the former experiencing dramatic growth, while the reverse was true for downloads and CDs, which exhibited […]

See All

Other Topics:

You should spend about 20 minutes on this task. The graph below shows the number of passenger railway journeys made in Great Britain between 1950 and 2004/5. Summarize the information by selecting and reporting the main features, and make comparisons where relevant. Write at least 150 words.

The line graph illustrates journeys made in Great Britain in three transit systems named National rail network, London Underground and Light rail& metro systems, based on millions of passengers, from 1950 to 2004/5. Overall, an upward trend was observed in the total amount of public transports. Nationl rail network topping the wnd of the period, […]

The graph below shows the crude marriage rate in five different countries between 1980 and 2020. Summarise the information by selecting and reporting the main features and make comparisons where relevant.

The line graph illustrates the number of marriages per 1,000 people in five different nations (USA, UK, Japan, Italy, and Sweden) between 1980 and 2020. Overall, the number of marriages in almost all selected countries experienced a downward trend over the period, with the exception of Sweden, which fluctuated and peaked at approximately 5.5 marriages […]

The graph below shows the daily consumption of three spreads per person from 1981 to 2007 in a country. Summarise the information by selecting and reporting the main features, and make comparisons where relevant. You should write at least 150 words.

The line grap below illustrates the daily consumption of three spreads per person over a 26-year period in a country. Overall, butter consumption per person, which was the highest figure among the three spreads dramatically declined, whereas the lowest spread “low fat and reduced spreads” rose to more than five times its initial figure. Meanwhile, […]

The line graph shows the percentage of travel by four different transport types in one country between 1985 and 2015. Summarise the information by selecting and reporting the main features, and make comparisons where relevant.

The line graph given compares four different transports in one country between 1985 and 2015, at 5-year intervals. Looking at the illustration, it is immediately evident that car recorded the highest percentages in most years, whereas the opposite was true for bus. Additionally, most transportations surveyed showed an upward trend, except for bus. In 1985, […]

The graph below shows the amount of electricity produced from different energy sources to supply the city of New York between 1980 and 2000.

The depicted line chart represents the electricity created from various sources of energy to provide the city of New York between 2 decades. In overview, from 1980 to 1990, coal and petroleum followed the similar trend. While the energy formed by natural gas experienced inclining trend. Primarily, the electricity produced from natural gas was the […]

The charts show the sales of five different kinds of jam from 2009 to 2014. Summarize the information by selecting and reporting the main features and make comparisons where relevant.

The line graph illustrates the sales of five various kinds of jam between 2009 and 2014. Overall, it is clear that the strawberry jam was the most demanding product by the and of the period, while the plum jam was the least popular. In contrast, the sales of raspberry and cherry jams fluctuated over the […]

See All
We have detected unusual activity on your device.
Please verify your identity to continue.
Note: This verification step won't sign you in. If you have a premium account, please log in to access the service as usual.
Google/Gmail Verification
Or verify using Email/Code
We've sent a verification code to:
youremail@gmail.com (Not your email?)
Enter it below to complete the verification process.
Ensure your email address is correct, your inbox is not full, and you check your spam folder. If no email arrives, consider using an alternative email.
You will need a Premium plan to perform your action!
Note: If you already have a premium account, please log in to access our services as usual.

Plans & Pricing

Our mission is to make quality education accessible for everyone.
However, to keep our hardworking team running and this service alive, we genuinely need your support!
By opting for a premium plan, not only do you sustain us in achieving the mission, but you also unlock advanced features to enrich your learning experience.

Free

For learners who aren't pressed for time

What's included on Free
100+ Cambridge IELTS Tests
Instant IELTS Writing Task 1 & 2 Evaluation (2 times/month)
Instant IELTS Speaking Part 1, 2, & 3 Evaluation (2 times/month)
Instant IELTS Writing Task 1 & 2 Essay Generator (2 times/month)
500+ Dictation & Shadowing Exercises
100+ Pronunciation Exercises
Flashcards
Other Advanced Tools

Premium

For those serious about advancing their English proficiency, and for IELTS candidates aspiring to boost their band score by 1-2 points (especially in writing & speaking) in just 30 days or less

What's included on Premium
Save Your IELTS Test Progress & Analyze Mistakes By Question Type
Save Your Own Flashcard Sets & Use Them On Any Device
Unlock All Courses, IELTS Tests, Section & Part Practice
Unlimited AI Conversations
Unlimited AI Writing Enhancement Exercises
Unlimited IELTS Writing Task 1 & 2 Evaluation
Unlimited IELTS Speaking Part 1, 2, & 3 Evaluation
Checked Answers Will Not Be Published
Unlimited IELTS Writing Task 1 & 2 Essay Generator
Unlimited IELTS Speaking Part 1, 2, & 3 Sample Generator
Unlimited Usage Of Advanced Tools & AI Features
Priority Support within 24h (12-month plan only)

Due to the nature of our service and the provided free trials, payments are non-refundable.