Our system will evaluate the answer based on this AI-generated description.
The image contains two line graphs relating to household electrical appliances and time spent doing housework between 1920-2019. The top graph shows the percentage of households with electrical appliances, with data for washing machines increasing from nearly 0% in 1920 to almost 100% by 2019, refrigerators starting at 0% in 1920 to also nearly 100% by 2019, and vacuum cleaners beginning around 0% in 1920 and reaching over 90% by 2019. The bottom graph depicts the number of hours of housework per week, per household, with two lines representing "total hours per week" and "hours per week", both decreasing over time. The "total hours per week" drops from approximately 50 hours in 1920 to around 15 hours by 2019, while the "hours per week" shows a similar decline, starting at around 50 hours in 1920 and falling to about 10 hours by 2019. Notably, there is a slight increase in hours around 1960 for both lines, followed by a steady decline.
Given the complexity of the image, the above description may not be entirely accurate.
Skyrocket your IELTS band score by 1-2 points in under a month with our premium plan!
Note: Both the topic and the answer were created by one of our users.
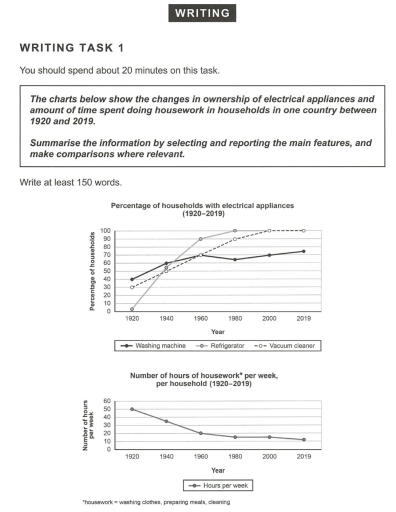
The line graphs illustrate the changes in ownership of electrical appliances and the amount of time which the households spent for their housework in a specific country during the years 1920 to 2019. Overall, meanwhile owning the home appliances grew constantly, the time that individuals spent for house tasks declined.
The first diagram demonstrates that although by 1920 almost no house had a refrigerator, after 1980 it became an essential and 100% of houses had one. Similarly, while only 30% of households owned vacuum cleaner in 1920, this ownership rate reached a plateau on 100% by 2000. Washing machine ownership experienced the similar ratio and grew constantly from 40% in 1920 and reached to well over 70 percent in 2019.
In contrast, while the people in this country used to spent 50 hours per week to clean their houses, washing clothes, and preparing meals in 1920, they did not spend more than 20 hours per week to do the same in 1960. The amount of housework was gradually declined to just above than 10 hours in 2019.
Word Count: 177