Our system will evaluate the answer based on this AI-generated description.
The image displays a line graph illustrating international tourists in millions visiting France, USA, and Japan from 2000 to 2020. France's data: 2000 (77), 2001 (79), 2002 (81), 2003 (83), 2004 (82), 2005 (83), 2006 (84), 2007 (86), 2008 (88), 2009 (87), 2010 (85), 2011 (86), 2012 (86), 2013 (84), 2014 (85), 2015 (87), 2016 (86), 2017 (88), 2018 (89), 2019 (90), 2020 (91). USA's data: 2000 (51), 2001 (52), 2002 (53), 2003 (54), 2004 (55), 2005 (56), 2006 (57), 2007 (57), 2008 (56), 2009 (55), 2010 (54), 2011 (53), 2012 (52), 2013 (51), 2014 (50), 2015 (49), 2016 (47), 2017 (45), 2018 (44), 2019 (42), 2020 (42). Japan's data: 2000 (15), 2001 (15), 2002 (16), 2003 (17), 2004 (17), 2005 (19), 2006 (20), 2007 (21), 2008 (23), 2009 (24), 2010 (25), 2011 (27), 2012 (28), 2013 (30), 2014 (33), 2015 (36), 2016 (41), 2017 (47), 2018 (52), 2019 (54), 2020 (50).
Given the complexity of the image, the above description may not be entirely accurate.
Skyrocket your IELTS band score by 1-2 points in under a month with our premium plan!
Note: Both the topic and the answer were created by one of our users.
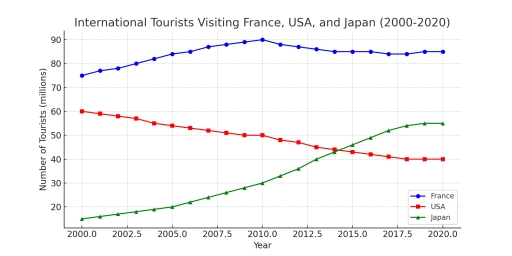
The graph illustrates tourists’ journeys to three different countries between 2000 and 2020. The countries are France, the USA, and Japan. The graph compares the number of tourists over those years.
In general, these countries had fluctuating graphs. The countries had different proportions. It is clear that France is the most popular country. Japan did significantly better between 2000 and 2020. The USA went down since 2000.
The graph shows France had 75 million tourists in 2000. The indicator grew after 2000, while the indicator peaked in 2010. France’s indicator declined after 2010, and France’s index was the highest compared to the USA and Japan. The USA’s peak index was between 2000 and 2020; for example, the index in 2000 (60 million) compared to that in 2020 (40 million) went down by 20 million tourists. In contrast, Japan’s indicator had been steadily increasing all the time. The first time the index was around 10 million; after that, it had been steadily increasing. Finally, in 2020, the index showed 55 million.
In conclusion, every country had its own individual history during this time.
Word Count: 182