Our system will evaluate the answer based on this AI-generated description.
The image is a line graph titled "Recycling Rate for selected materials: 1982 - 2010" with the x-axis representing years from 1982 to 2010 and the y-axis representing recycling rate percentages from 0 to 90%. Four lines represent paper and cardboard, glass containers, aluminium cans, and plastics. In 1982, paper and cardboard had a recycling rate of approximately 20%, glass containers 55%, aluminium cans around 5%, and plastics nearly 0%. In 2010, paper and cardboard increased to about 75%, glass containers to 50%, aluminium cans to 70%, and plastics to almost 20%. Paper and cardboard show a steady increase over the years, with a slight dip between 1990 and 1994. Glass containers saw a gradual decrease over time, with slight fluctuations. Aluminium cans started the lowest but saw significant growth and surpassed other materials by 2010. Plastics began at nearly 0% and had a slower, gradual increase throughout the years.
Given the complexity of the image, the above description may not be entirely accurate.
Skyrocket your IELTS band score by 1-2 points in under a month with our premium plan!
Note: Both the topic and the answer were created by one of our users.
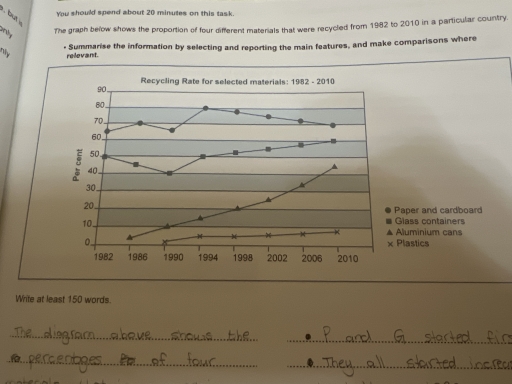
The diagram above shows the percentages and the years it took to reproduce of paper and cardboard, glass containers, aluminum cars, and plastics in a certain location between 1982 and 2010
The line graph started with paper and glass since 1982, one started increasing while the other began to decrease respectively. After a few years the roles reversed as paper and cardboard’s percentage dropped 10%, on the other hand the glass containers reached its peak as it rose 10% opposite to each other. Each one of the lines showed signs of an increase between 1990 and 1994, meanwhile the plastics had just started to be recycled.
Through the years they generally didn’t exhibit any progress except for aluminum cars that had a vast increase of reproduction over the years at 45%. It compared to plastic which was the slowest of all to increase, taking it 20 years (1990-2010) to increase to almost 9%.
Word Count: 153