Our system will evaluate the answer based on this AI-generated description.
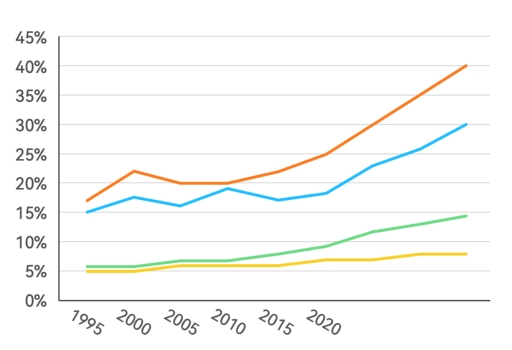
The image shows a line chart with four lines representing different data trends plotted against years 1995, 2000, 2005, 2010, 2015, 2020 on the x-axis and percentages ranging from 0% to 45% on the y-axis; the topmost line starts just above 15% in 1995, increases steadily to just under 25% by 2005, follows a steeper incline to almost 35% by 2010, and continues the rise to surpass 40% by 2020; the second-highest line begins just below 15% in 1995, experiences a slight dip to above 10% by 2000, ascends to just over 20% by 2010 and finishes near 30% by 2020; the third line, starting near 5%, progresses modestly to approach 10% in 2010 and concludes near 15% by 2020; the lowest line also commences at approximately 5%, shows a gradual incline to 10% by 2010, and reaches above 10% by 2020; no specific data points are labeled or marked on any lines.
Given the complexity of the image, the above description may not be entirely accurate.
Skyrocket your IELTS band score by 1-2 points in under a month with our premium plan!
Note: Both the topic and the answer were created by one of our users.
The line graph illustrates the age brackets of European people who went to gyms once in a month or more from 1990 to 2010
Overall, it appears that, at the beginning of the period, all age categories preferred less. There were a consistently grow in the proportions of all age groups, exception of 18-24 age brackets. Although 18-24 age groups showed the most highest proportion during the given period
The proportion of 18-24 age category commenced with approximately 8% initially, and it experienced a dramatic increase to 60% from 1990 to 2006. At the end of the period, it remained unchanged at this rate. Regarding 25-34 age group, it started with 10%. The percentage of 25-34 age group witnessed only consistently rise by 40% during the given period.
In accordance with 35-44 age category, it approximately increased by 15% from 5% to 20% between 1990 and 2006. Then it showed an upward trend to 40%. When it comes to 45 and over age group percentages made up 1% in 1990. After increasing to 5% in 2004, it showed a growth by 5% until at the end of the period
Word Count: 189