Our system will evaluate the answer based on this AI-generated description.
The image shows a line chart with four lines representing different data trends plotted against years 1995, 2000, 2005, 2010, 2015, 2020 on the x-axis and percentages ranging from 0% to 45% on the y-axis; the topmost line starts just above 15% in 1995, increases steadily to just under 25% by 2005, follows a steeper incline to almost 35% by 2010, and continues the rise to surpass 40% by 2020; the second-highest line begins just below 15% in 1995, experiences a slight dip to above 10% by 2000, ascends to just over 20% by 2010 and finishes near 30% by 2020; the third line, starting near 5%, progresses modestly to approach 10% in 2010 and concludes near 15% by 2020; the lowest line also commences at approximately 5%, shows a gradual incline to 10% by 2010, and reaches above 10% by 2020; no specific data points are labeled or marked on any lines.
Given the complexity of the image, the above description may not be entirely accurate.
Skyrocket your IELTS band score by 1-2 points in under a month with our premium plan!
Note: Both the topic and the answer were created by one of our users.
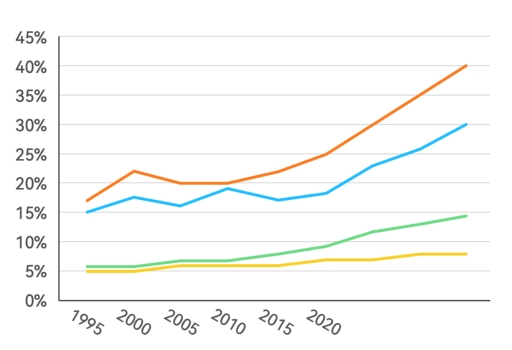
Given is a graphic illustrating what percentage of four different age range who went to a gym more than twice a week in New Zealand over a 35 year period between 1995 to 2020.
It is clear that the amount of 29-39 age group and 18-28 age group witnessed a dramatic increase, while the figure of the elder people who belong to the age group 40-50 and 51-61 showed a slow rise trend.
Commencing with the individuals from 18-28, the percantage manifested a minor fluctuation and go up generally by about 2% until 2010. While after 2010, it showed a upward trend and became the most important which would jump to 40% percantage at the end of period . With regarding to the age group from 18-28, they saw an fluctauting upward tendency since 1995 and the amount of them mostly approach the 29-39 which was about 20%.
By contrast, people from 40-50 saw a stale trend before 2010 and a lightly 5% increase afterwards. In addition, the propotion of 51-61 age group remained stale around 6% over this period.
Word Count: 180