Our system will evaluate the answer based on this AI-generated description.
The image presents a bar chart depicting the percentage of home ownership among different age groups in Australia from 1981 to 2011. For the age group 65+, home ownership was approximately 77% in 1981, rising to around 79% in 1991, remaining at about 80% in 2001, and slightly increasing to 82% in 2011. In the 55-64 age group, the figures were about 78% in 1981, growing to approximately 81% in 1991, maintaining around 82% in 2001, and reaching close to 84% in 2011. For those aged 45-54, the percentages were roughly 74% in 1981, escalating to about 78% in 1991, peaking to around 80% in 2001, and reaching 82% in 2011. In the 35-44 age group, home ownership was around 61% in 1981, increasing to about 68% in 1991, rising to approximately 70% in 2001, and reaching 74% in 2011. Lastly, for the 25-34 age group, the ownership started at approximately 39% in 1981, grew to about 48% in 1991, slightly increased to 50% in 2001, and remained stable at 50% in 2011.
Given the complexity of the image, the above description may not be entirely accurate.
Skyrocket your IELTS band score by 1-2 points in under a month with our premium plan!
Note: Both the topic and the answer were created by one of our users.
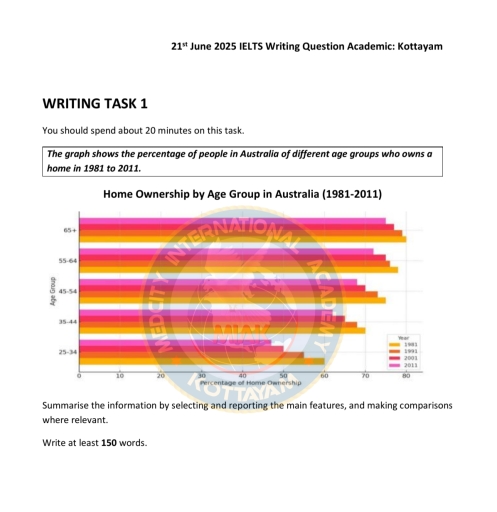
The bar chart illustrates the proportions of home ownership among different age groups in Australia between 1981 and 2011.
Overall, the older the age group, the higher home ownship rates throughout the period. Meanwhile, the rate of ownerships for younger age groups (25-34 and 35-44) showed a downward trend, whereas fluctuations were found in older age groups’ (45-54 and 55-64) home ownership percentages.
Regarding younger age groups, the ownership percentage for 25-34 years old started at about 65% in 1981, followed by a steady decrease to below 50% in 2011. On the other hand, the ownership rate for the age group from 35 to 44 years old began at a value similar to the youngest age group, but experienced a much less significant slide to about 56% in 2011.
Turning to the older age groups, the oldest age group (55-64 years old) had the highest ratio of home ownership among four age groups throughout two decades, which started started at a peak of 84% in 1981, followed by minor fluctuation to 80% in 2011. Furthermore, the ownership proportion for the age group of 45-54 years old had the similar trend as the oldest age group, but the numbers are about 10% lower at each time point during this period.
Word Count: 209