Our system will evaluate the answer based on this AI-generated description.
The image features a line graph with two lines representing 'Software' and 'Games' profit from 2011 to 2019; Software profit rose from about 600 in 2011, to approximately 1000 in 2013, dipped slightly in 2014 to just under 1000, up to around 1200 in 2015, a more pronounced drop to around 600 in 2016, back up to roughly 1200 in 2017, then a decline back to near 1000 in 2018, and an increase to approximately 1500 in 2019; Games profit started around 2500 in 2011, went down to a little above 2000 in 2012, increased to approximately 3000 in 2013, declined to around 2000 in 2014, saw a major increase to nearly 3500 in 2015, followed by a sharp drop to just above 1500 in 2016, another rise to about 2500 in 2017, a decrease back to near 1500 in 2018, and a spike to roughly 3000 in 2019. Data points are approximations due to lack of precise numeric labels on the y-axis.
Given the complexity of the image, the above description may not be entirely accurate.
Skyrocket your IELTS band score by 1-2 points in under a month with our premium plan!
Note: Both the topic and the answer were created by one of our users.
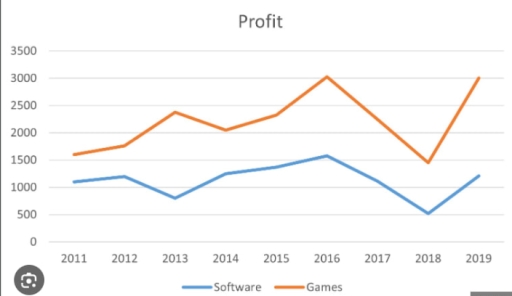
The line graph gives information about profit of software and games during the period from 2011 to 2019.
Overall, the highest rate were games with 3000, while the rate of software was 1500 in 2016.
In the beginning of the year the rate of games were 1600 while the rate of software was 1100. Nevertheless the level of games went up dramatically to 2400, while the rate of software declined gradually to 900
In 2016 the profit of the games dramatically decreased to 1500 coming the year 2018. From 2014 to 2016 the rate of software increased slightly, and coming to 2018 it was decreased to 500. Finally the rate of games went back to the old rate 3000 while the level of software increased to 1100 in 2019
Word Count: 129