Our system will evaluate the answer based on this AI-generated description.
The image shows a graph plotting percentage against time from 1980 to 2010 at 5-year intervals for four categories: Art Gallery, Pavilion, Pier, and Festival. Art Gallery starts at 20% in 1980, increases to 32.5% in 1985, 22.5% in 1990, drops to 20% in 1995, rises to 27.5% in 2000, declines to 22.5% in 2005, and finishes at 25% in 2010. Pavilion begins at 15% in 1980, rises to 27.5% in 1985, drops to 22.5% in 1990, increases to 30% in 1995, falls to 22.5% in 2000, remains steady through 2005, and ends at 17.5% in 2010. Pier starts at 25% in 1980, falls to 15% in 1985, rises sharply to 47.5% in 1990, drops to 42.5% in 1995, plummets to 12.5% in 2000, rises slightly to 17.5% in 2005, and finishes at 20% in 2010. Festival commences at 40% in 1980, decreases to 25% in 1985, jumps to 37.5% in 1990, declines steeply to 5% in 1995, increases to 10% in 2000, remains stable in 2005, and ends at 37.5% in 2010.
Given the complexity of the image, the above description may not be entirely accurate.
Skyrocket your IELTS band score by 1-2 points in under a month with our premium plan!
Note: Both the topic and the answer were created by one of our users.
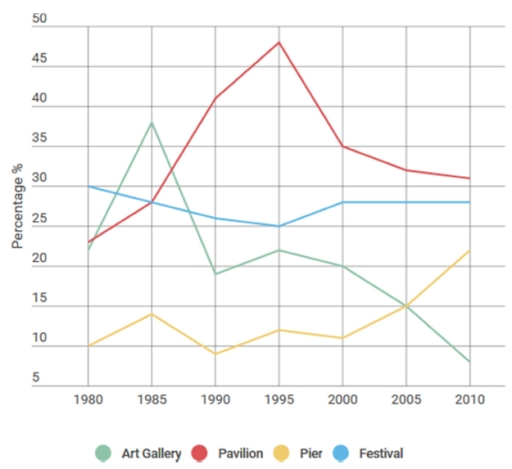
The given line graph depicts the figure for visitors to England who went to four separate attractions in Brighton from 1980 to 2010.
Overall, it is clear that while the percentage of people visiting the pavillion and the pier increased, the opposite trend was observed for the proportion of tourists who came to the art gallery and the festival.
In 1980, only 10% of tourist to England went to the pier. But then, after some minor fluctuations, this figure rose from about 9% to roughly 23% between 1990 and 2010. The percentage of travelers visiting the Pavillion experienced a significant increase from 23% in 1980 to almost 50% in 1995. However, this figure dropped suddenly to 35% in 2000 and then fell gradually to roughly 32% in 2010, slightly higher than the festival.
The most popular Brighton attraction in 1980 was the festival. Although 30% of these attended the festival in 1980, by 2010 this percentage had fallen slightly to 28 %. In 1980, the figure for tourists to the art gallery started at 21%, it then reached a peak of 37% in 1990, before dropped sharply to less than 10% in 2010. It was, therefore, the least popular attractions at the end of the period.
Word Count: 206