Our system will evaluate the answer based on this AI-generated description.
The image presents a line graph from 2000 to 2014 detailing numerical data for four entities: China, European Union, Asia (without China), and USA. In 2000, China starts at 8, European Union at 28, Asia (without China) at 26, and USA at 12. By 2002, China reaches 10, European Union at 26, Asia (without China) at 22, and USA at 11. In 2004, China's data moves to 15, European Union sits at 24, Asia (without China) at 19, and USA at 10. By 2006, China edges up to 19, European Union remains at 23, Asia (without China) remains steady at 19, and USA slightly lowers to 9. The 2008 data shows China at 23, European Union continuing at 23, Asia (without China) consistent at 19, USA at 9. In 2010, China advances to 27, European Union decreases to 21, Asia (without China) is steady at 19, and USA slightly dips to 8. By 2012, China records 32, European Union decreases to 20, Asia (without China) at 20, and USA charts 7. In 2014, China tops at 36, European Union stabilizes at 20, Asia (without China) at 21, and USA declines further to 6.
Given the complexity of the image, the above description may not be entirely accurate.
Skyrocket your IELTS band score by 1-2 points in under a month with our premium plan!
Note: Both the topic and the answer were created by one of our users.
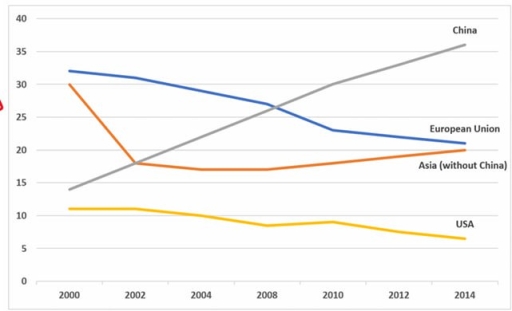
The line graph demonstrates the proportion of clothing exports in four nations from 2000 to 2014.
As is observed, it is explicit that three countries namely European Union, Asia (without China), and USA showcased the downward trend, while the opposite was true for China over a fourteen-year period. Moreover, China experienced the most noticeable increase and dominated the three regions from the middle time onwards.
In 2000, China exported nearly 15% of clothing, after that, by the consecutive improvement, its figure still remained the highest position from 2008 to 2014, which accounted for over 35% in the final year. Besides that, the entire exports in Asia began with 30% in 2000, and after undergoing a significant decline and contributing the same rate as China in 2002, the figure rose marginally to 20% in 2014.
The European Union, which had the largest percentage of clothing exports in 2000, followed the lessening trend during 14 years and made up approximately 21% in the last year. In Particular, the trend for the USA oscillated and recorded a decrease from about 11% in 2000 to more than 5% in 2014.
Word Count: 186