Our system will evaluate the answer based on this AI-generated description.
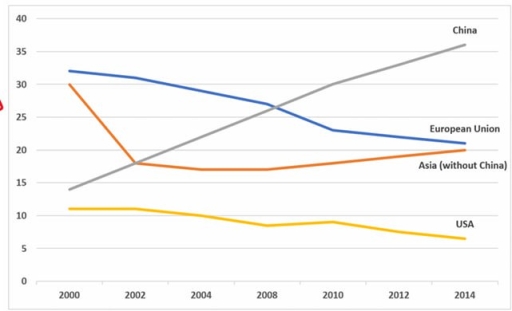
The image presents a line graph from 2000 to 2014 detailing numerical data for four entities: China, European Union, Asia (without China), and USA. In 2000, China starts at 8, European Union at 28, Asia (without China) at 26, and USA at 12. By 2002, China reaches 10, European Union at 26, Asia (without China) at 22, and USA at 11. In 2004, China's data moves to 15, European Union sits at 24, Asia (without China) at 19, and USA at 10. By 2006, China edges up to 19, European Union remains at 23, Asia (without China) remains steady at 19, and USA slightly lowers to 9. The 2008 data shows China at 23, European Union continuing at 23, Asia (without China) consistent at 19, USA at 9. In 2010, China advances to 27, European Union decreases to 21, Asia (without China) is steady at 19, and USA slightly dips to 8. By 2012, China records 32, European Union decreases to 20, Asia (without China) at 20, and USA charts 7. In 2014, China tops at 36, European Union stabilizes at 20, Asia (without China) at 21, and USA declines further to 6.
Given the complexity of the image, the above description may not be entirely accurate.
Skyrocket your IELTS band score by 1-2 points in under a month with our premium plan!
Note: Both the topic and the answer were created by one of our users.
The data present how population in New York City have been changes through 200 years. The tables below present changes of five districts of New York City (Manhattan, Brooklyn, Bronx, Queens, Staten Island) over 200 years. Overall, the population had been increased sharply through 200 years and the tables show similarities data not that different.
In first table, the data shows how population increase in New York between 1800 to 2000 for all five cities. In 1800 the beginning of research the residence number was about 79,016. After 100 years a sharply rise happened; it rise for about 2 times to reach about 3,437,202. In 2000, 2 times growth happened to population show that New York has been grown increasingly to reach about 8,008,185.
If we go through all the districts, it’s shown that all of them had an increase unless Manhattan. There is a huge dramatically declined in population. In 1800, the percentage was around 76% of total population in Manhattan. After 100 years like the rest of New York, there is an increase, but it was presented only 54% of total population.
In 2000, the number go down to reach 19% of total New York City population.
Word Count: 199