🔥 Today Only: Save 30% on Premium — Offer Ends Soon! - Upgrade Now!
Table

Band 6+: The maps show art gallery in Australia in 1950 and now.

Image for topic: The maps show art gallery in Australia in 1950 and now.
Our system will evaluate the answer based on this AI-generated description.
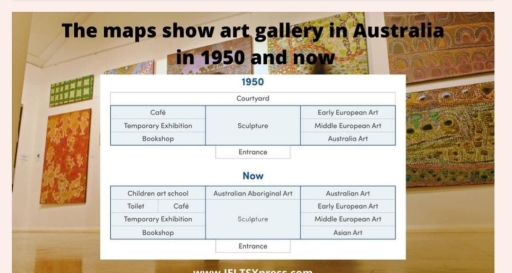
The image depicts the layout of an art gallery in Australia in the years 1950 and now. In 1950, starting from the entrance: a bookshop is to the left, followed by a temporary exhibition space and a café; the courtyard is centrally located behind the entrance; sculptures occupy a space behind the courtyard; Early European Art is on the right side, followed by Middle European Art and Australian Art. In the present layout: starting from the entrance, the sequence is as follows; a bookshop is on the left, followed by a temporary exhibition space, a café, and a toilet; Australian Aboriginal Art occupies the central position; sculptures are positioned behind this area; Early European Art remains in the top right and Middle European Art in the middle; Australian Art is on the right, and a new addition, Asian Art, is on the bottom right.
Given the complexity of the image, the above description may not be entirely accurate.
Note: Both the topic and the answer were created by one of our users.

The charts illustrate the changes in Australia’s art gallery in 1950 and present time. Overall, it is shown that there are no significant changes in the structure of the museum at the present time. However, there are some differences which are put on view.

Firstly, it is clear that Aboriginal Art of Australia was added above the Sculpture. However the sculpture itself remained in the same postiion. Moreover, Australian and Asian arts were added on the right from the entrance.

Back in 1950 there were no space for the restroom. However, it was built by now and it shares the area with the cafe. Also, it is clearly seen that there is a new museum department, which is Children art school.

In summary, there are no obvious changes of the museum at the first look, However, as the analysis has done, it is notceable that a big number of new departments were added, and it is certainly more convenient, because the art gallery has a restroom and diversity of various cultures.

Word Count: 171

Answers On The Same Topic:

The maps show art gallery in Australia in 1950 and now.

The provided maps delineate the architectural evolution of an art gallery in Australia from 1950 to the present day. The transformation of the gallery’s layout underscores significant modifications and additions, enhancing both its functionality and artistic representation. In 1950, the gallery’s entrance was flanked by a bookshop on the left, succeeded by a temporary exhibition […]

The maps show art gallery in Australia in 1950 and now.

The maps illustrates the layout of Australia art gallery in 1950 and the present day. Overall, it is clear that, the art gallery has been modernised in present time, especially on, the northeast side of the layout adding toilet and children art school.However, Austrialian aboriginal art which provide extra furnishing layout now, In 1950, In […]

The maps show art gallery in Australia in 1950 and now.

The two maps demonstrate the changes of Australian art gallery from 1950 to now. Overall, the art gallery consisted of large rooms in the beginning of period and by now, it altered to another shapes. It is clear that in 1950, there was a courtyard in the south side of art gallery, after reconstruction courtyard […]

The maps show art gallery in Australia in 1950 and now.

The maps illustrate how an art gallery in Australia has changed from 1950 to the present day. Overall, Art gallery’s layout has experienced a significant transformation during the whole period becoming more informative due to addition of new art sectors and comfortable with the constraction of new social facilities. Of particular note is that many […]

See All

Other Topics:

The table chart gives information about languages with the most native speaker

The table chart illustrates details about languages that have the most native speakers as well as people who speak them as a second language. Overall, Mandarin Chinese has the highest number of native speakers, while English has the biggest total number of language users because many people use it as additional language. Other languages have […]

The table below shows the information about the posts held by women in parliament and in management in 5 countries in 2000. Summarise the information by selecting and reporting the main features and make comparisons where relevant.

The given table compares the percentages of positions of women in government and management in five different nations, comprising Canada, Norway, Tobago and Trinidad, Uruguay, and Italy, in 2000. Overall, the proportions of the posts held by females in parliament were higher than that in management in all countries. Additionally, while Norway accounted for the […]

Finding out main information by selecting and reporting and make comparisons where relevant EE ki

The table illustrates the percentage of pupils enrolled in four types of secondary schools, namley Specialist Schools, Grammar Schools, Voluntary-controlled Schools, and Community Schools- across the years 2000, 2005, and 2009. Overall, while the proportion of students attending Community Schools increased significantly over the period, all other school types experienced a consistent decline in enrolment. […]

The table below gives average yearly weather statistics of four cities.

The table shows average annual weather statistics in four capital cities: Edinburgh, Paris, Helsinki, and Casablanca. The information given includes annual rainfall, the number of wet days, annual snowfall, the annual temperature range and the hours of sunlight per day. Overall, the rainiest city of this group is Edinburgh, while the most humid is Helsinki […]

The tables below give information about the consumption and production of potatoes in different world regions in 2006. Summarize the information by selecting and reporting the main features, and make comparisons where relevant.

The table show information about potato consumption and production in different region in 2006. Overall the table illustrate that the highest per person consumption in lg is in Europe . The lowest also per person consumption in kg is in Africa . In terms of production the asia/ ocenia had highest . Europe follow closely […]

the table below shows the results of survey of first-year students who take courses in a particular university

The table illustrates the percentage of students gave good ratings for different aspects of a university in three different years. Overall, it is clear that the highest proportions of rating witnessed by the print and electronic resources, while range of models offered had the significant lowest throughout the period. In detail, print resources accounted for […]

See All
We have detected unusual activity on your device.
Please verify your identity to continue.
Note: This verification step won't sign you in. If you have a premium account, please log in to access the service as usual.
Google/Gmail Verification
Or verify using Email/Code
We've sent a verification code to:
youremail@gmail.com (Not your email?)
Enter it below to complete the verification process.
Ensure your email address is correct, your inbox is not full, and you check your spam folder. If no email arrives, consider using an alternative email.
You will need a Premium plan to perform your action!
Note: If you already have a premium account, please log in to access our services as usual.

Plans & Pricing

Our mission is to make quality education accessible for everyone.
However, to keep our hardworking team running and this service alive, we genuinely need your support!
By opting for a premium plan, not only do you sustain us in achieving the mission, but you also unlock advanced features to enrich your learning experience.

Free

For learners who aren't pressed for time

What's included on Free
100+ Cambridge IELTS Tests
Instant IELTS Writing Task 1 & 2 Evaluation (2 times/month)
Instant IELTS Speaking Part 1, 2, & 3 Evaluation (5 times/month)
Instant IELTS Writing Task 1 & 2 Essay Generator (2 times/month)
500+ Dictation & Shadowing Exercises
100+ Pronunciation Exercises
Flashcards
Other Advanced Tools

Premium

For those serious about advancing their English proficiency, and for IELTS candidates aspiring to boost their band score by 1-2 points (especially in writing & speaking) in just 30 days or less

What's included on Premium
Save Your IELTS Test Progress
Unlock All Courses & IELTS Tests
Unlimited AI Conversations
Unlimited AI Writing Enhancement Exercises
Unlimited IELTS Writing Task 1 & 2 Evaluation
Unlimited IELTS Speaking Part 1, 2, & 3 Evaluation
Checked Answers Will Not Be Published
Unlimited IELTS Writing Task 1 & 2 Essay Generator
Unlimited IELTS Speaking Part 1, 2, & 3 Sample Generator
Unlimited Usage Of Advanced Tools
Priority Support within 24h (12-month plan only)

Due to the nature of our service and the provided free trials, payments are non-refundable.
Nếu bạn là người Việt Nam và không có hoặc không muốn trả bằng credit/debit cards, bạn có thể thanh toán bằng phương thức chuyển khoản:


Chọn gói:
419,000₫ 277,000 ₫ cho gói 1 tháng (chỉ 9,233₫/ngày)
1,239,000₫ 597,000 ₫ cho gói 3 tháng (chỉ 6,633₫/ngày)
2,469,000₫ 1,027,000 ₫ cho gói 6 tháng (chỉ 5,706₫/ngày)
4,929,000₫ 1,417,000 ₫ cho gói 12 tháng (chỉ 3,936₫/ngày)


Sau khi chuyển khoản, vui lòng đợi trình duyệt tự động điều hướng bạn trở lại Engnovate và bạn sẽ ngay lập tức nhận được mã kích hoạt tài khoản premium.
Nếu có lỗi xảy ra, bạn có thể liên hệ với team thông qua một trong các phương thức: email đến helloengnovate@gmail.com hoặc nhắn tin qua facebook.com/engnovate.
Vì toàn bộ công cụ trên website đều có thể sử dụng thử miễn phí, Engnovate không hỗ trợ hoàn tiền.